Driven by robust business momentum and proactive execution of its reorganization, China-based internet retail giant Alibaba Group Holding Limited (BABA) thrived in the fiscal first quarter. The ongoing self-driven transformation has injected renewed energy into its businesses, fueling innovation, fostering organizational vitality, and empowering long-term growth focus.
Bolstered by strong business momentum and a steadfast commitment to operational efficiency, BABA achieved impressive financial results. Year-over-year, the company’s revenue and adjusted EBITA surged 14% and 32%, respectively, propelled by enhancements across all business segments.
BABA also bolstered its position by repurchasing $3.1 billion worth of ADSs in the first quarter, underpinned by its consistent generation of robust free cash flow. This financial strength and a solid balance sheet position BABA exceptionally well to enhance competitiveness and capitalize on emerging prospects.
Adding to its accomplishments, on May 25, Alibaba Cloud, the digital technology and intelligence bedrock of BABA, along with MongoDB, Inc. (MDB), a prominent player in non-relational databases, announced a four-year extension to their strategic global partnership.
By synergizing the MDB database with Alibaba Cloud’s distinct capabilities, BABA’s clientele can expedite innovation and business scalability. This collaboration, operating on ApsaraDB for MDB, effectively streamlines costs and enhances productivity. Consequently, BABA could benefit from an elevated customer experience.
Given this backdrop, let’s look at the trends of BABA’s key financial metrics to get an idea of why the stock could be a solid portfolio addition now.
Analyzing Alibaba's Financial Trends: Significant Shifts in Net Income and Other Key Metrics from 2020 to 2023
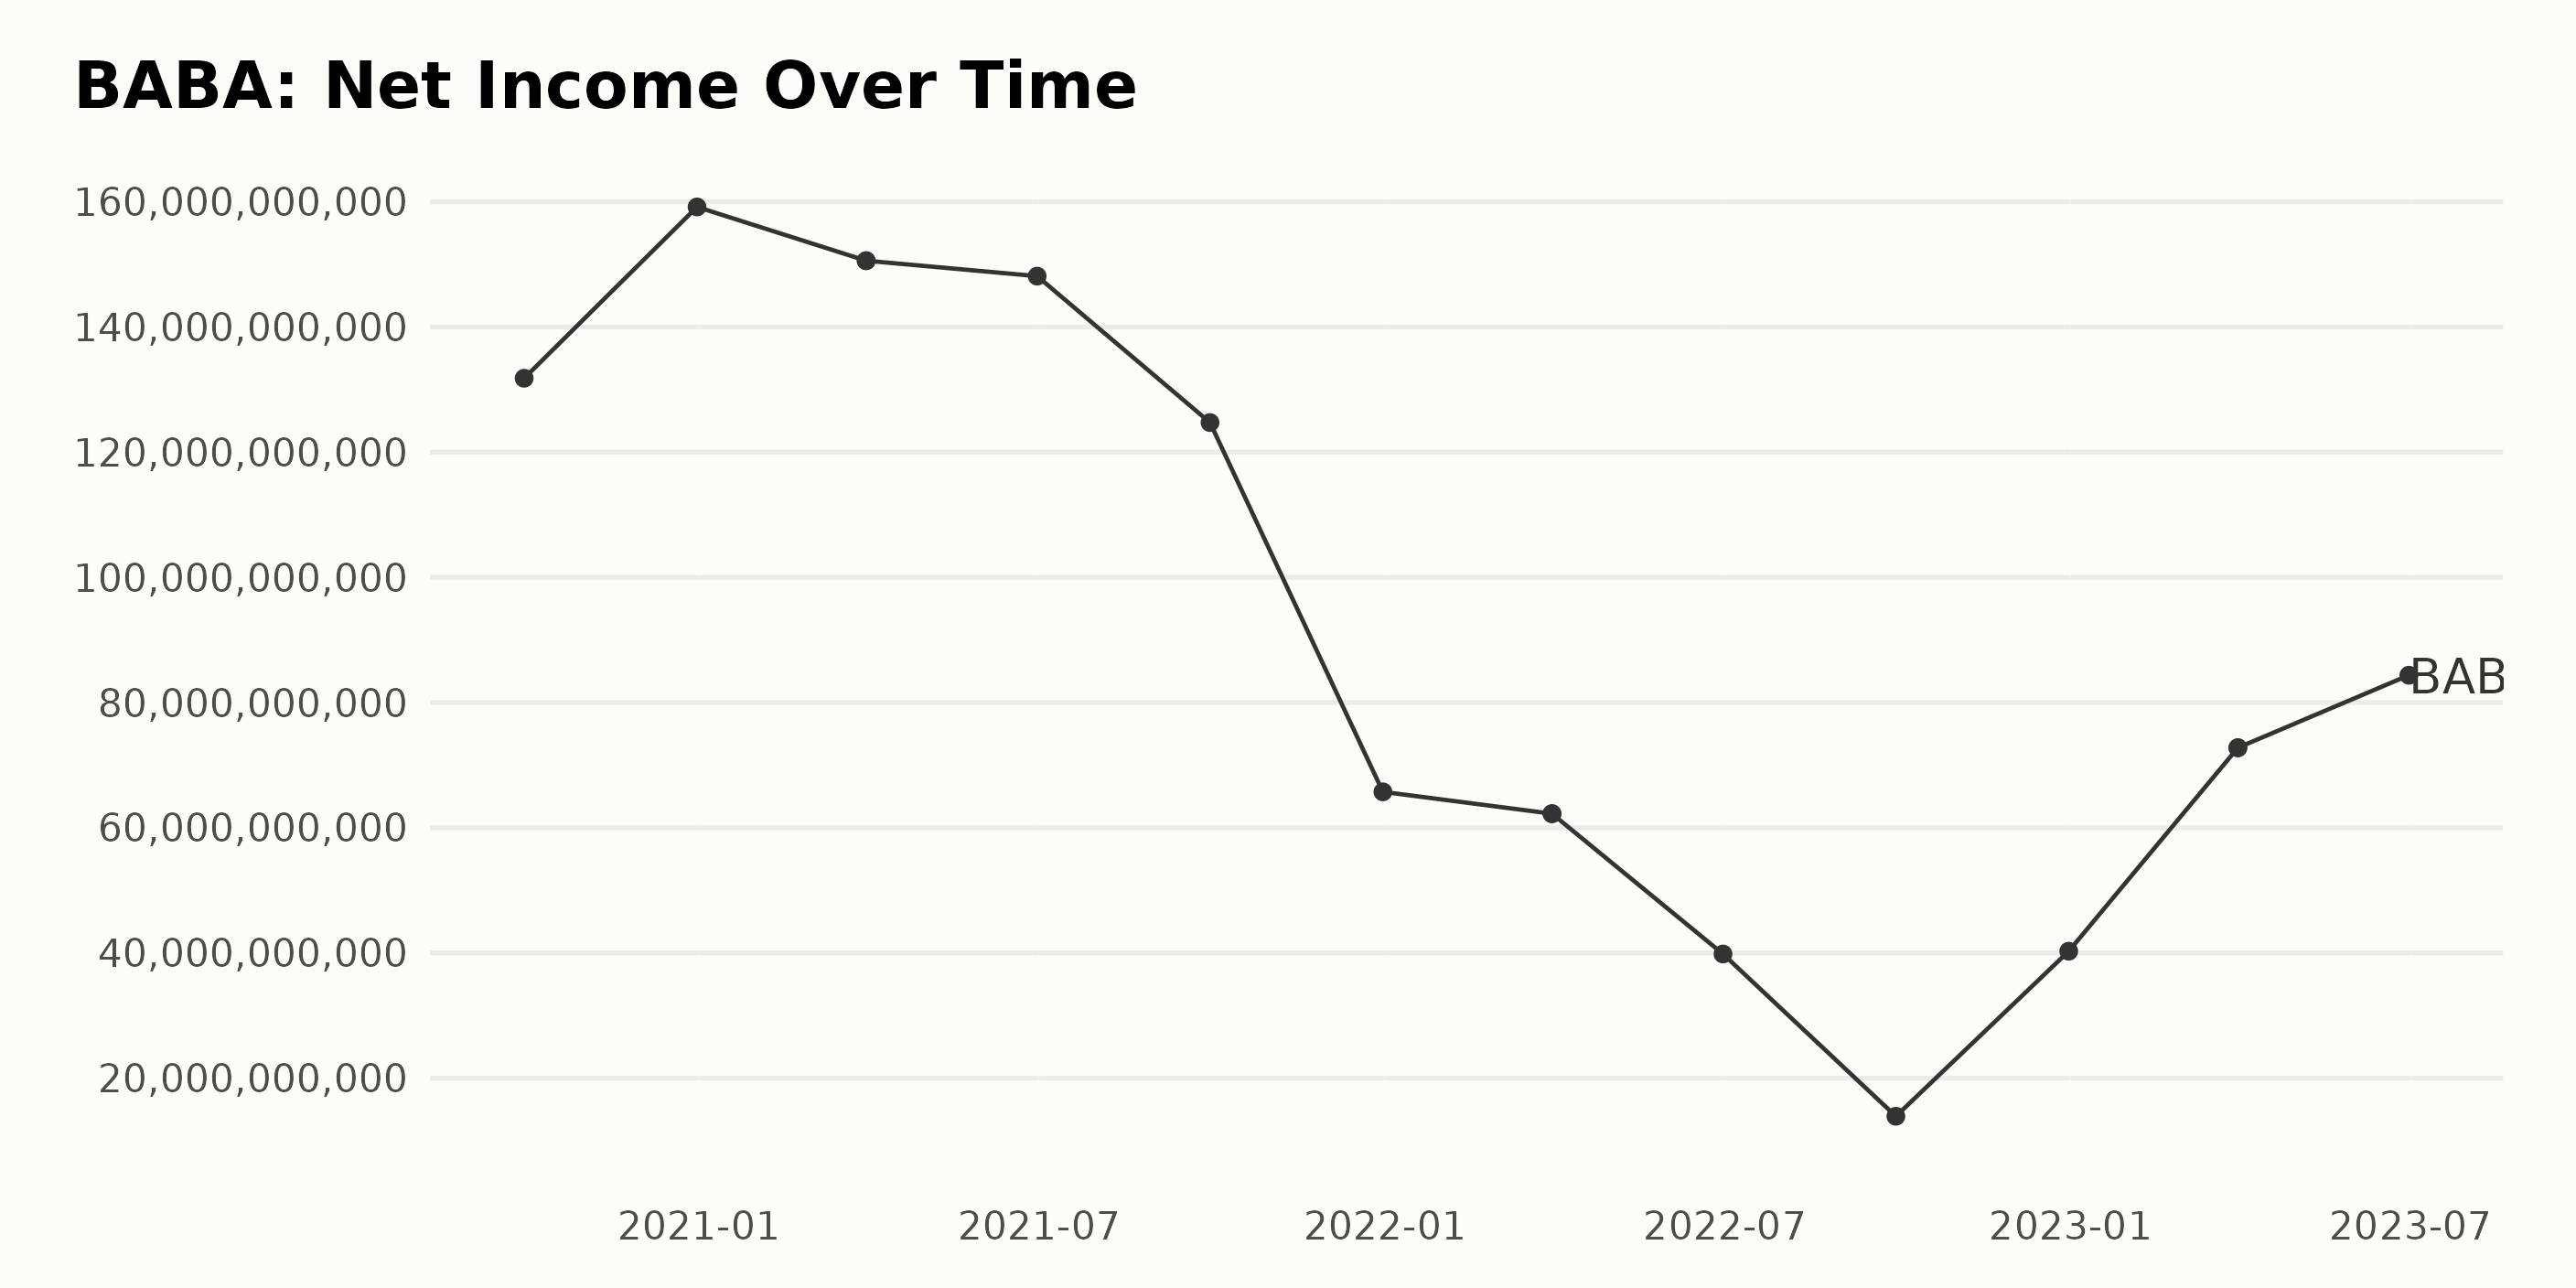
The data series represents BABA's reported trailing-12-month net income over a specified period. The observed trend and fluctuations are summarized below:
- By September 30, 2020, the net income stood at $131.80 billion.
- There was an upward fluctuation, with the value rising to $159.16 billion by December 31, 2020.
- From January 2021 to September 2021, there was a general downward trend. By September 30, 2021, the net income had dropped to $124.72 billion.
- This downward trajectory continued sharply till December 31, 2021, dipping to $65.74 billion and further down to a low of $13.919 billion by September 30, 2022.
- However, there was a resurgence to $40.29 billion on December 31, 2022, marking a notable recovery.
- Continuing its positive trajectory, BABA's net income reached $84.37 billion by June 30, 2023, which stands as the last reported value in this series.
In terms of growth rate, there is a decrease of approximately 36%. From these observations, it is clear that BABA’s net income has experienced significant volatility throughout this period, with a much stronger focus on more recent declines but with a promising recovery seen in the data toward the end of the series.
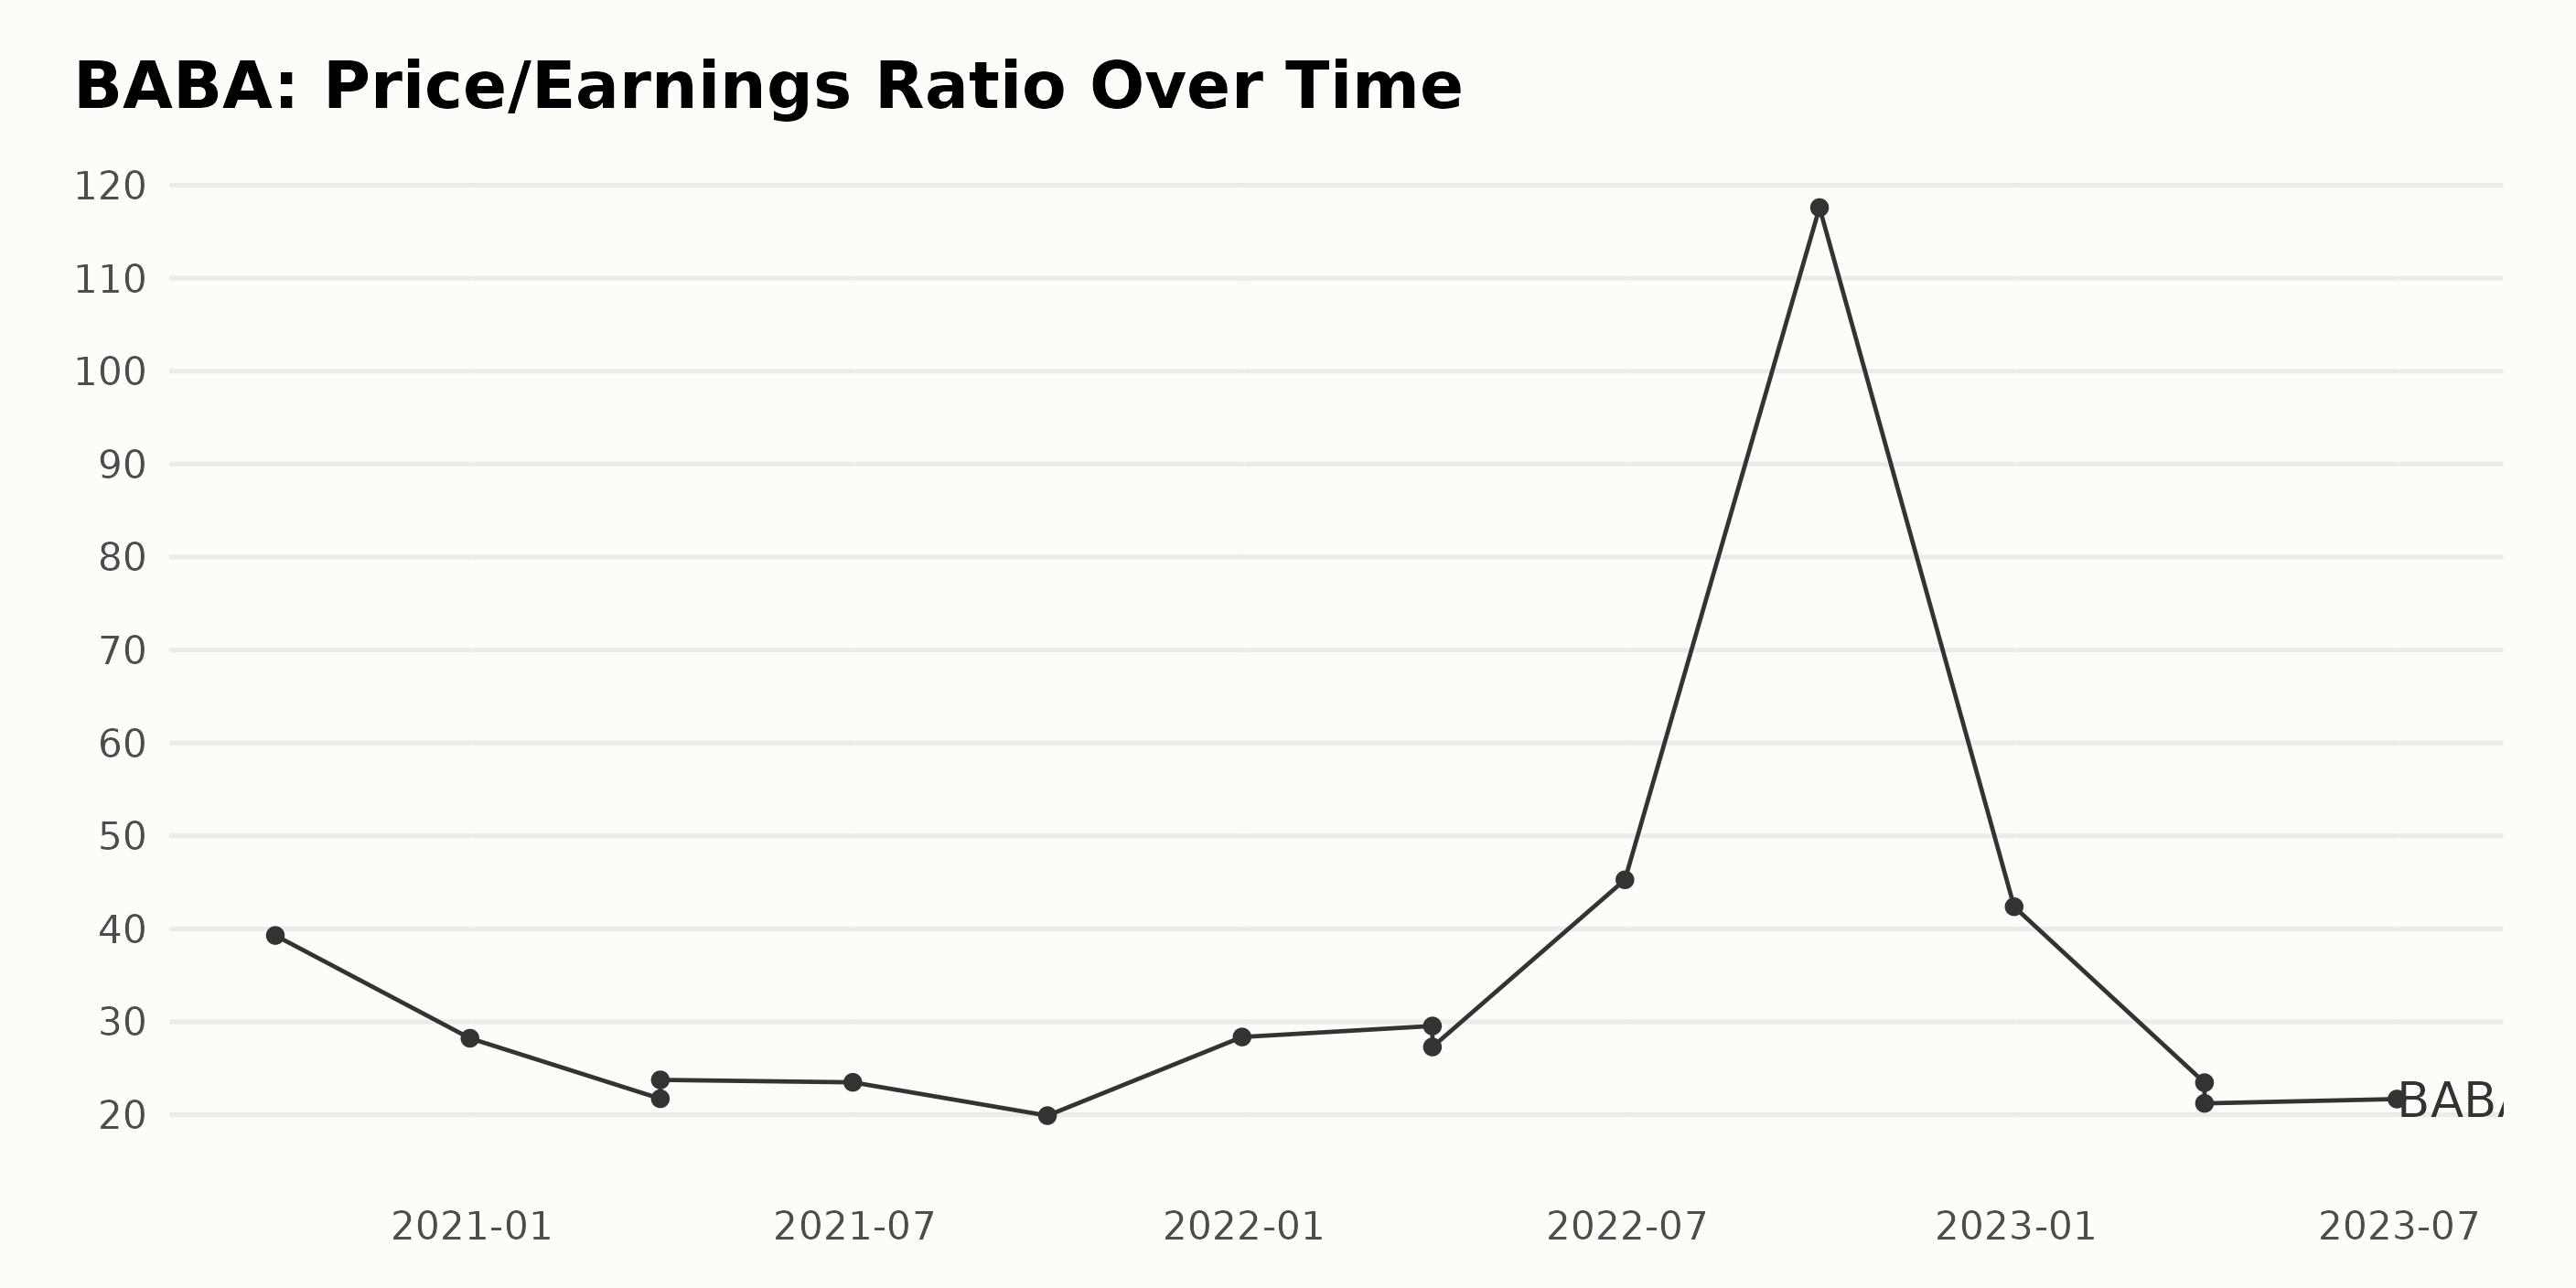
Here is a summarized analysis of the trend and fluctuations of the Price/Earnings Ratio (P/E) for BABA:
- From September 2020 to March 2023, BABA's P/E has fluctuated significantly from approximately 39.29 to 21.68.
- The highest P/E during this period was in September 2022 at 117.60, while the lowest was in September 2021 at about 19.90.
- The P/E declined steadily from 39.29 in September 2020 to 19.90 in September 2021. This decrease represents a significant reduction of approximately 49%.
- However, there was a drastic increase in the P/E after September 2021, peaking at 117.60 in September 2022. This surge reflects a growth rate of nearly 492% from the low point in September 2021.
- Post this peak, by December 2022, the P/E dropped steeply to 42.38, indicating a drop rate close to 64%.
- As of the most recent data point in June 2023, the P/E has stabilized somewhat, remaining relatively consistent at around 21.68.
In conclusion, the journey of BABA's P/E over this period has seen substantial volatility, with notable ups and downs. However, the P/E data does demonstrate that there is currently a return to the more typical values that were experienced prior to the significant escalation observed in late 2021 and early 2022.
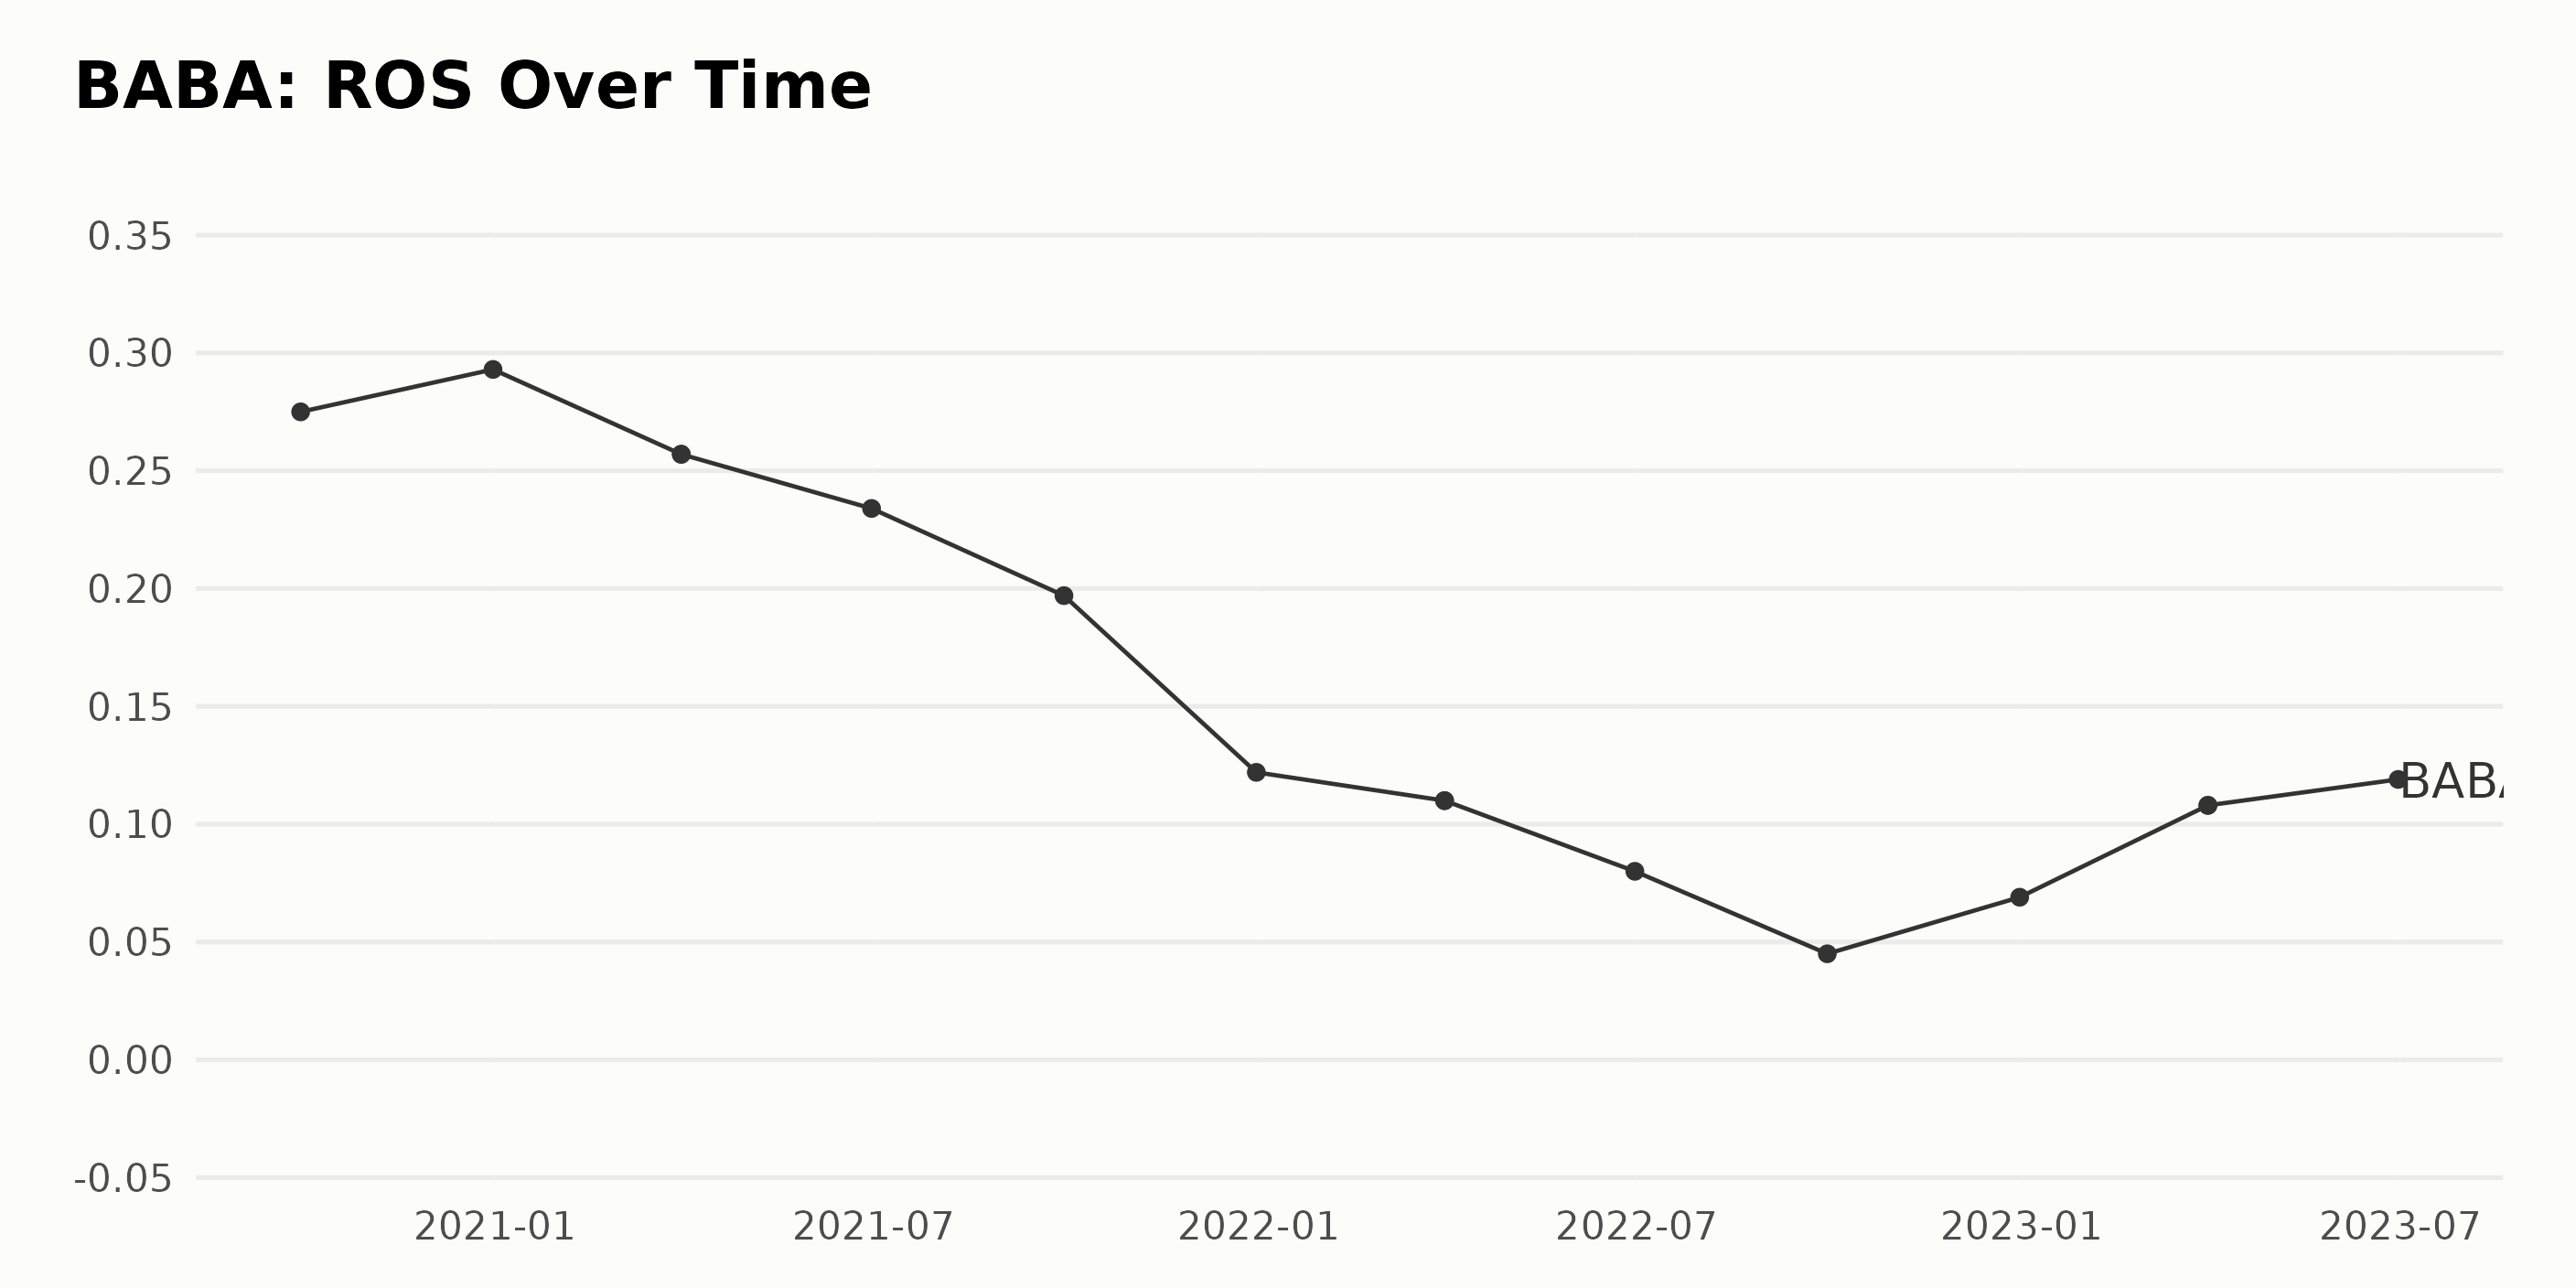
The financial data provided depicts ROS (Return On Sales) trends for the BABA over a period spanning from September 2020 to June 2023:
- As of September 30, 2020, the ROS stood at 27.5%.
- The highest recorded ROS within this period was 29.3% on December 31, 2020.
- From that peak, there was a general downward trend in ROS throughout 2021 and into early 2022. By September 30, 2022, the ROS had dropped significantly to 4.5%.
- However, there was a turnaround in ROS starting from December 31, 2022, when it rose to 6.9%.
- This upward trend continued into 2023, with ROS reaching 10.8% on March 31, 2023, and further increasing to 11.9% by June 30, 2023.
BABA’s ROS has experienced a decrease of approximately -57%. This indicates a negative growth rate over the observed period. However, recent data from the end of 2022 going into 2023 shows a slight recovery in ROS.
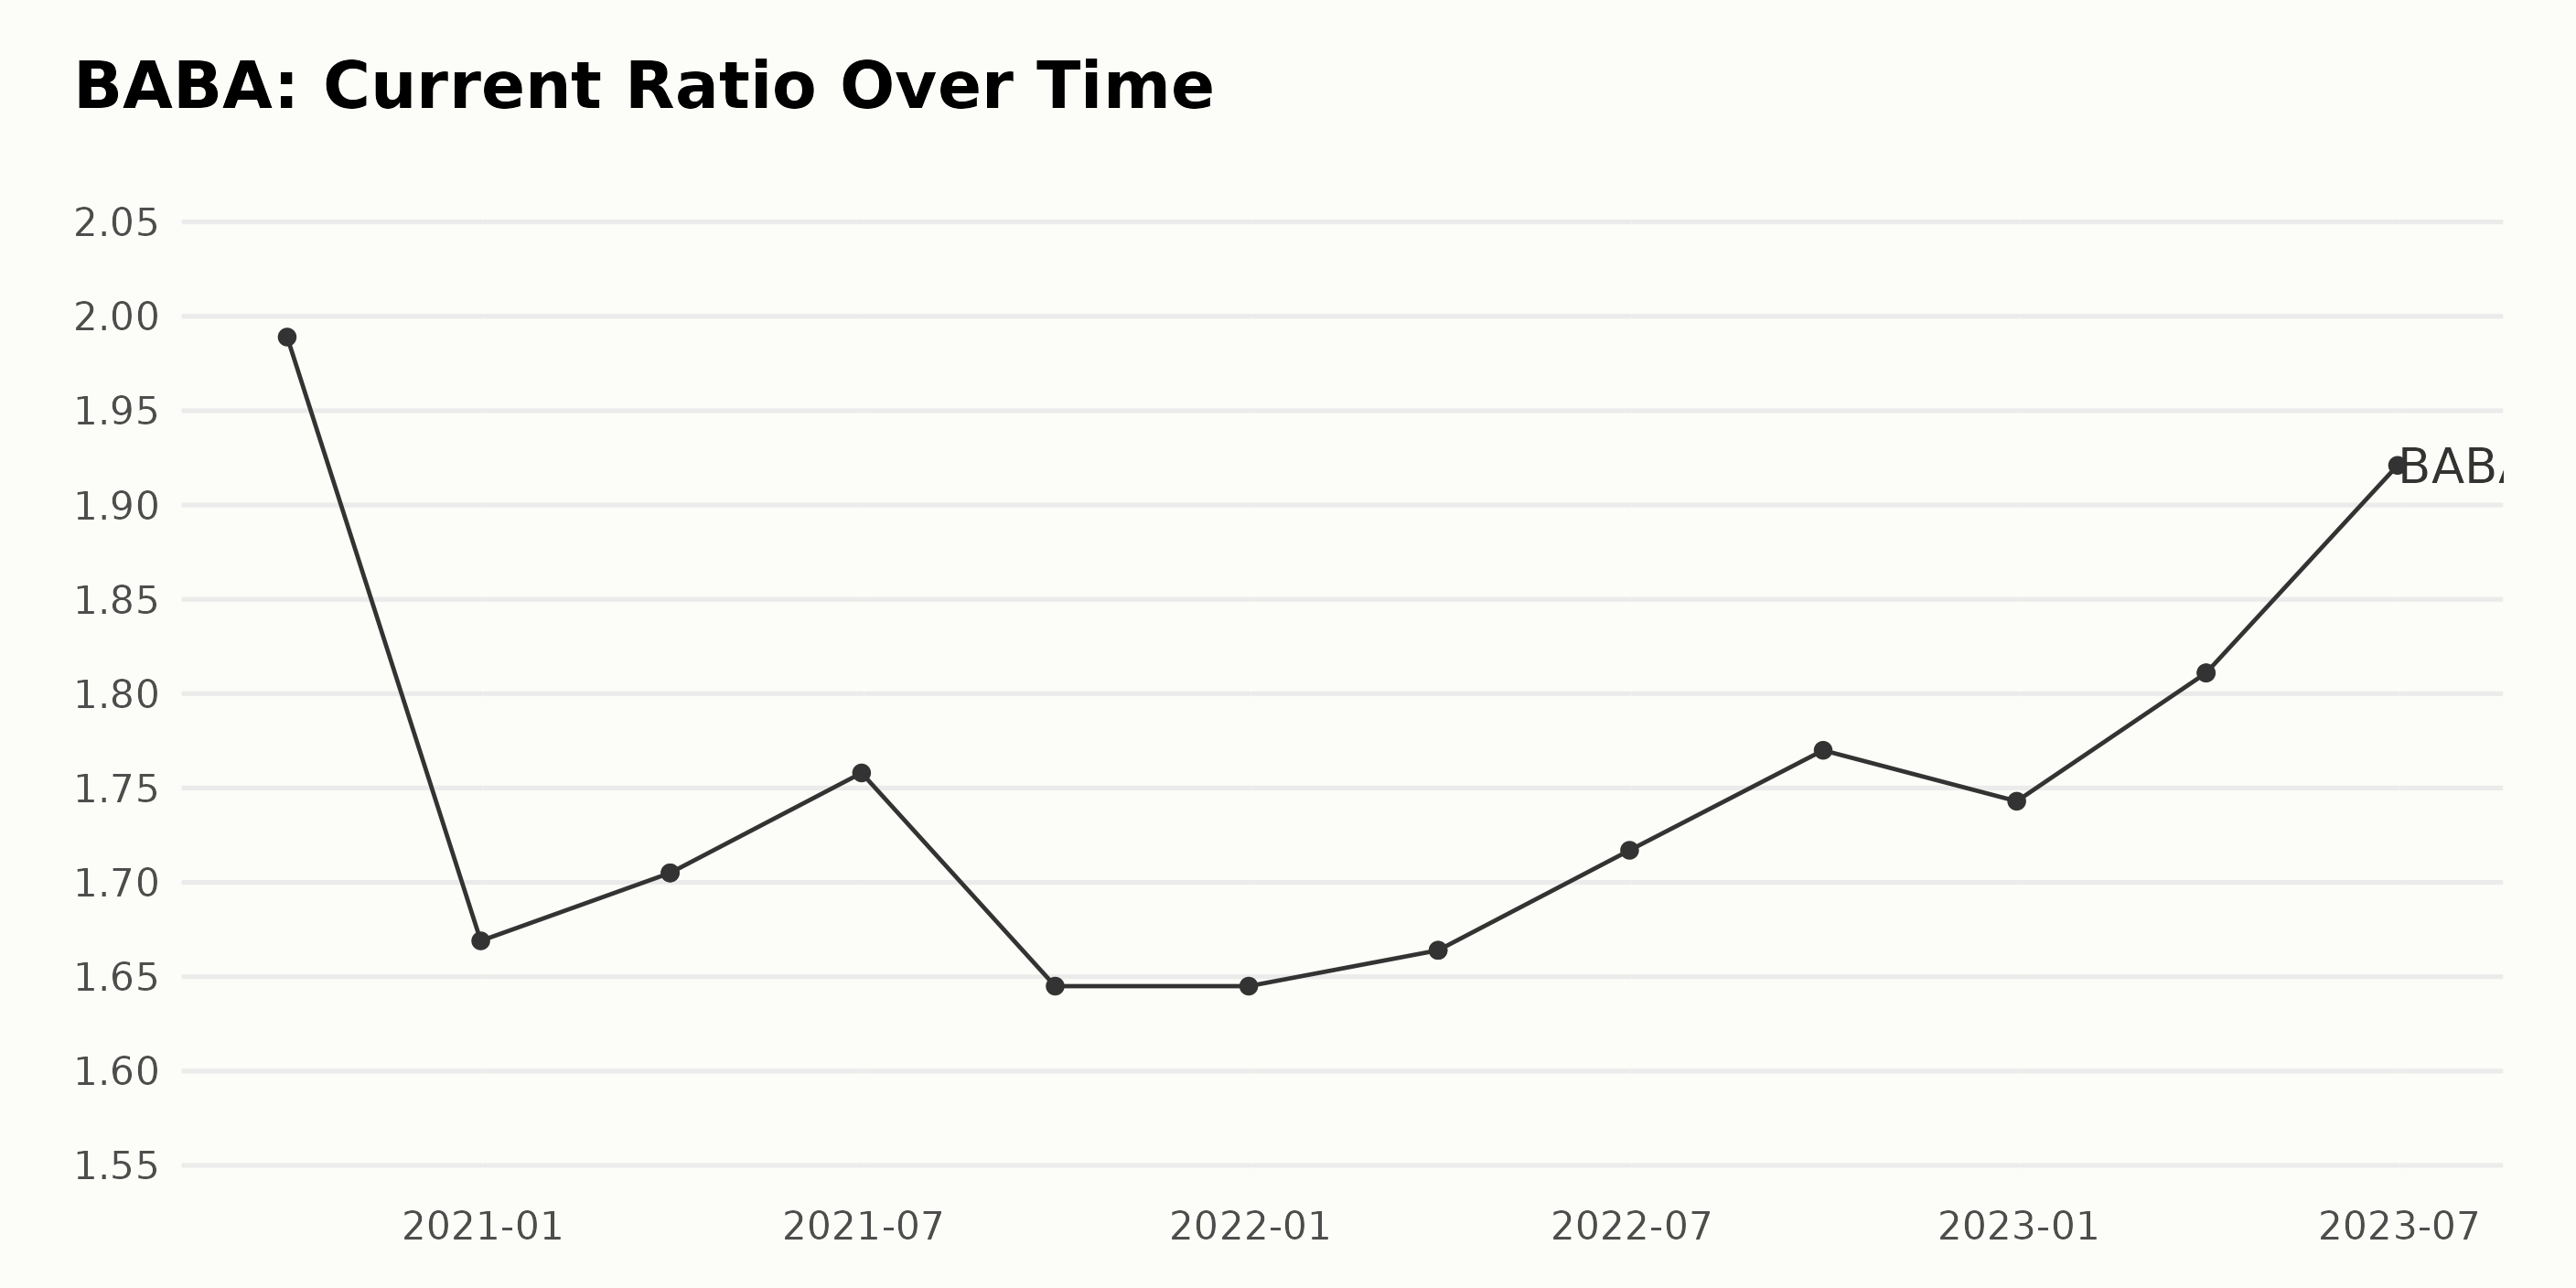
The current ratio of BABA demonstrated a fluctuating trend over time but with an overall uptick from September 2020 to June 2023.
- On September 30, 2020, BABA's current ratio started at approximately 1.99.
- By the end of December 2020, it decreased to about 1.67, marking a significant dip.
- The current ratio generally saw a further decrease, reaching the second-lowest point at around 1.64 by September and December 2021.
- This was followed by a moderate improvement in the first half of 2022, with the ratio gradually rising to about 1.71 by June 2022.
- Despite a slight lower in December 2022, the current ratio subsequently increased to around 1.81 on March 31, 2023.
- By June 30, 2023, the current ratio reached its peak at approximately 1.92.
In terms of growth rate, there has been a decrease of roughly -3.41%. Although the current ratio exhibited fluctuations throughout the period, the most recent data indicates an improvement. As of June 2023, the current ratio is notably higher than the same period in the previous year.
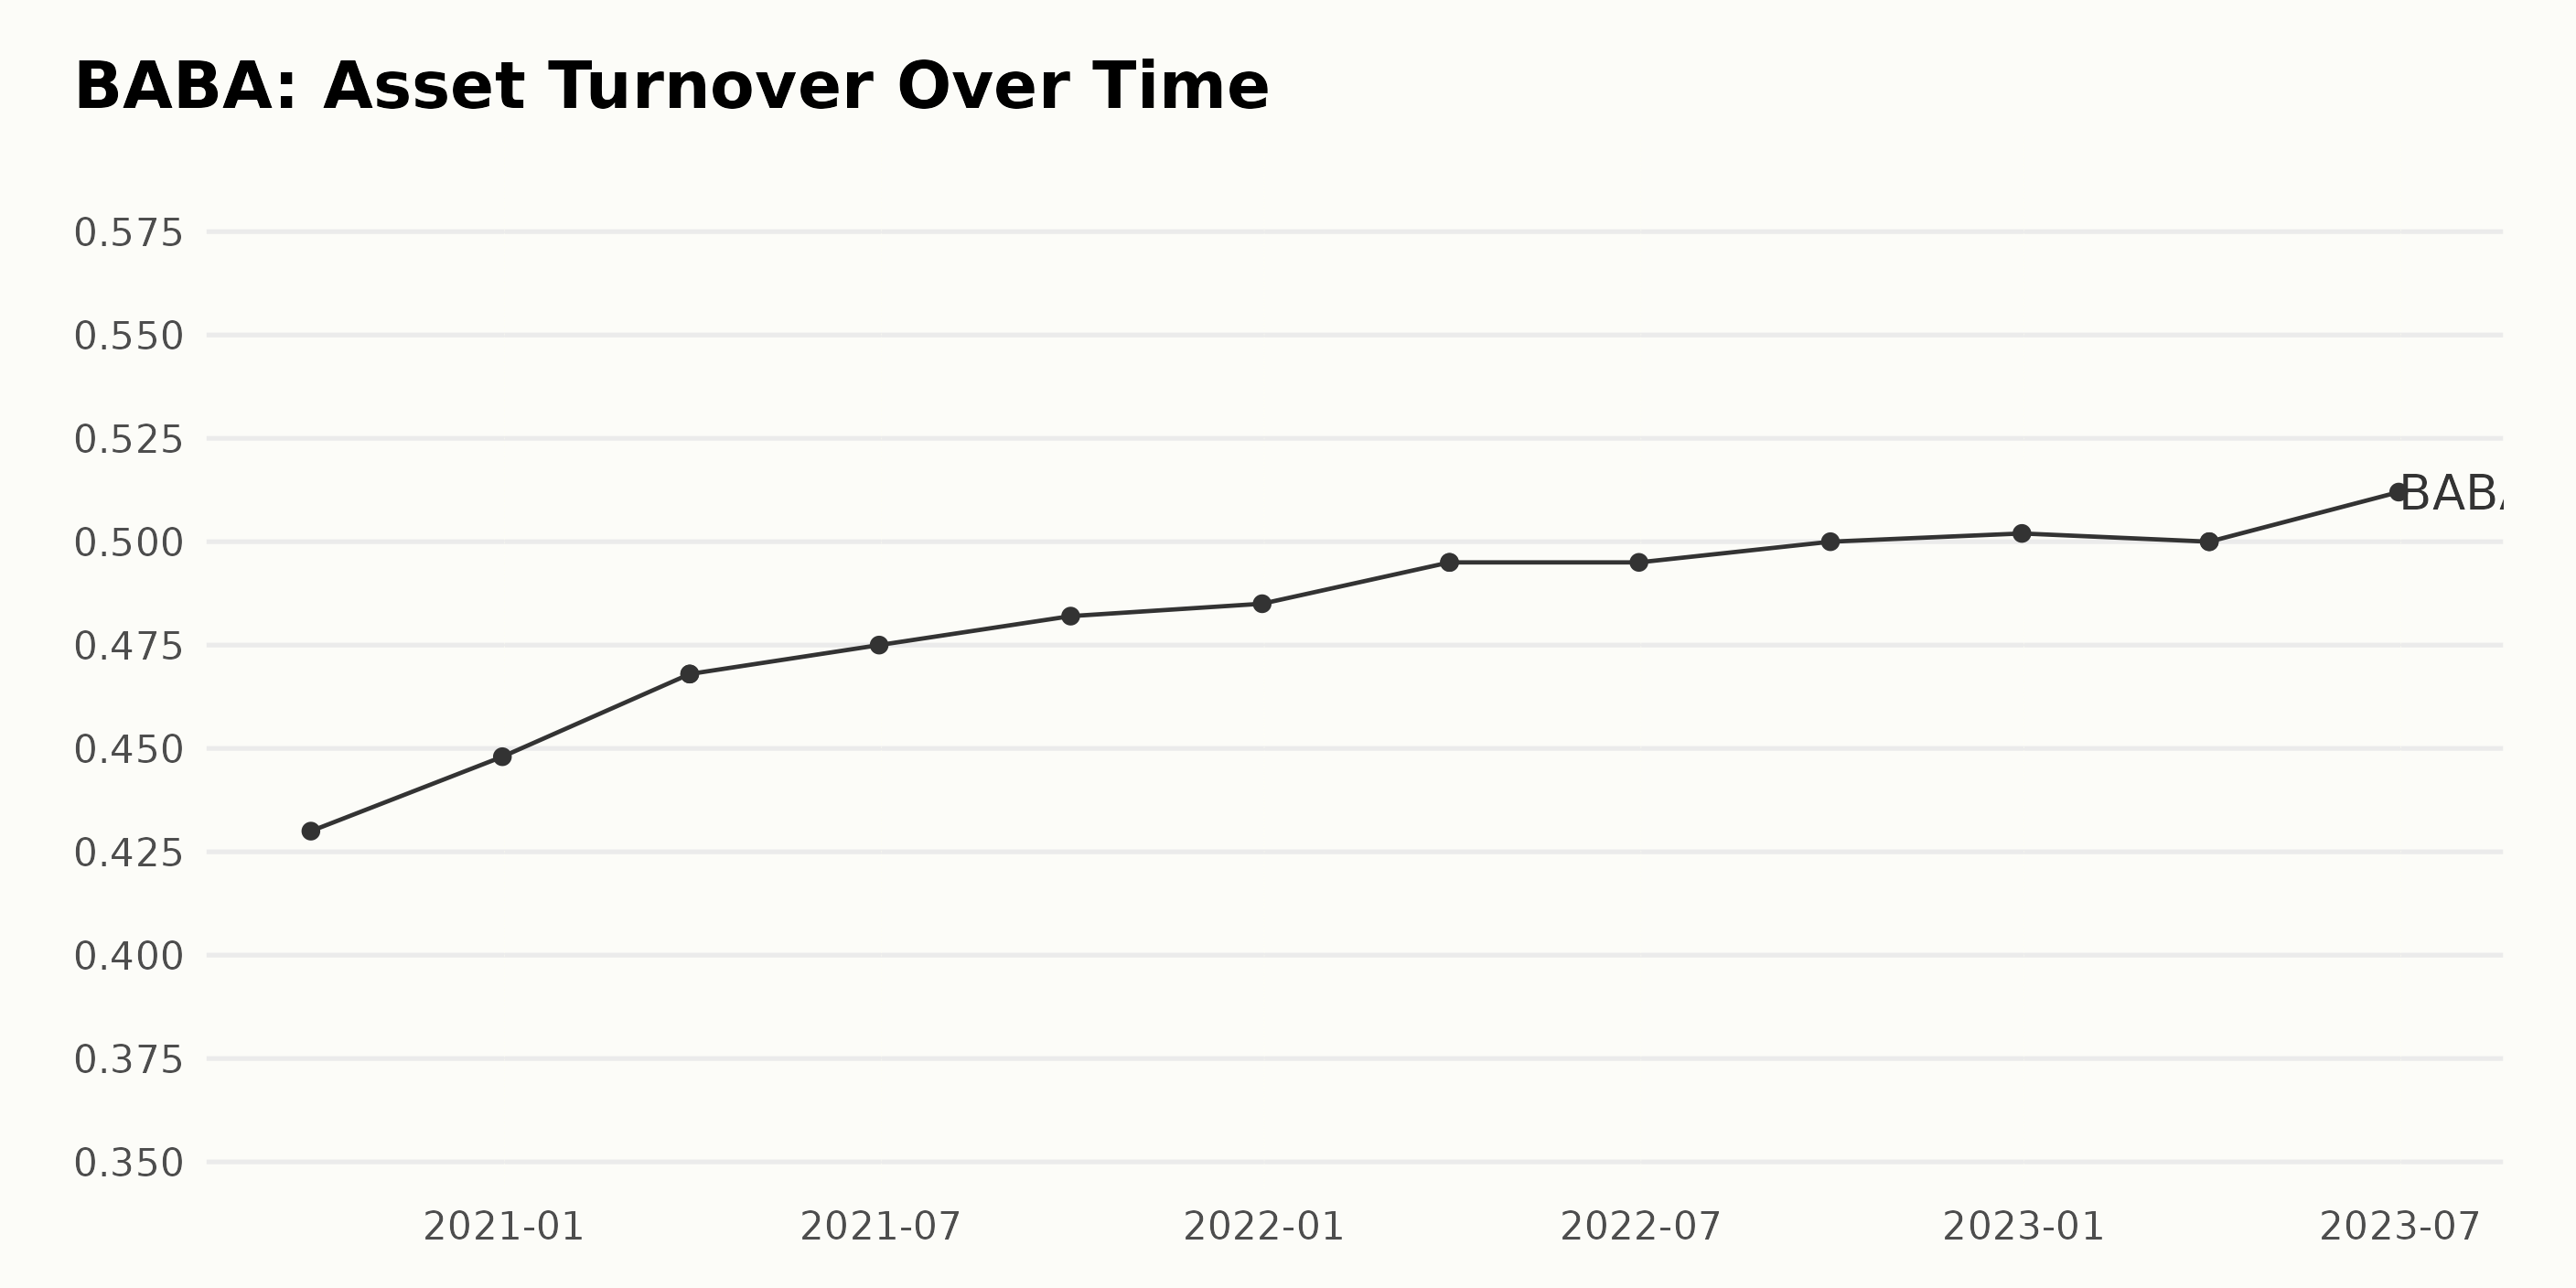
The asset turnover for BABA has exhibited a steady growth trend from September 2020 to June 2023. Here are the key highlights regarding the trend and fluctuations:
- Starting at 0.43 in September 2020, the asset turnover gradually increased to 0.512 by June 2023.
- There was a moderate increase in asset turnover from 0.43 in September 2020 to 0.448 in December of the same year.
- This upward trend continued through 2021, with slight fluctuations. The asset turnover reached 0.482 by September 2021.
- In 2022, a consistent growth pattern was observed till September, when it reached 0.5. Towards the end of the year, it slightly rose to 0.502 in December 2022.
- In 2023, it remained stable at 0.5 till March. Afterwards, in June, it noticeably increased to 0.512.
The growth rate indicates an increase of approximately 19%. This highlights a commendable improvement in BABA’s efficiency in using its assets to generate profits over the evaluated timeframe.
Assessing the more recent data, especially the last value of 0.512 in June 2023, it signifies that BABA has been maintaining a positive performance trend, and the company's asset turnover has been consistently growing over time despite some minor fluctuations.
In conclusion, BABA's effective resource management strategy has allowed for impressive and sustained growth in its asset turnover.
BABA’s Share Volatility and Incremental Growth Trend: March-August 2023 Analysis
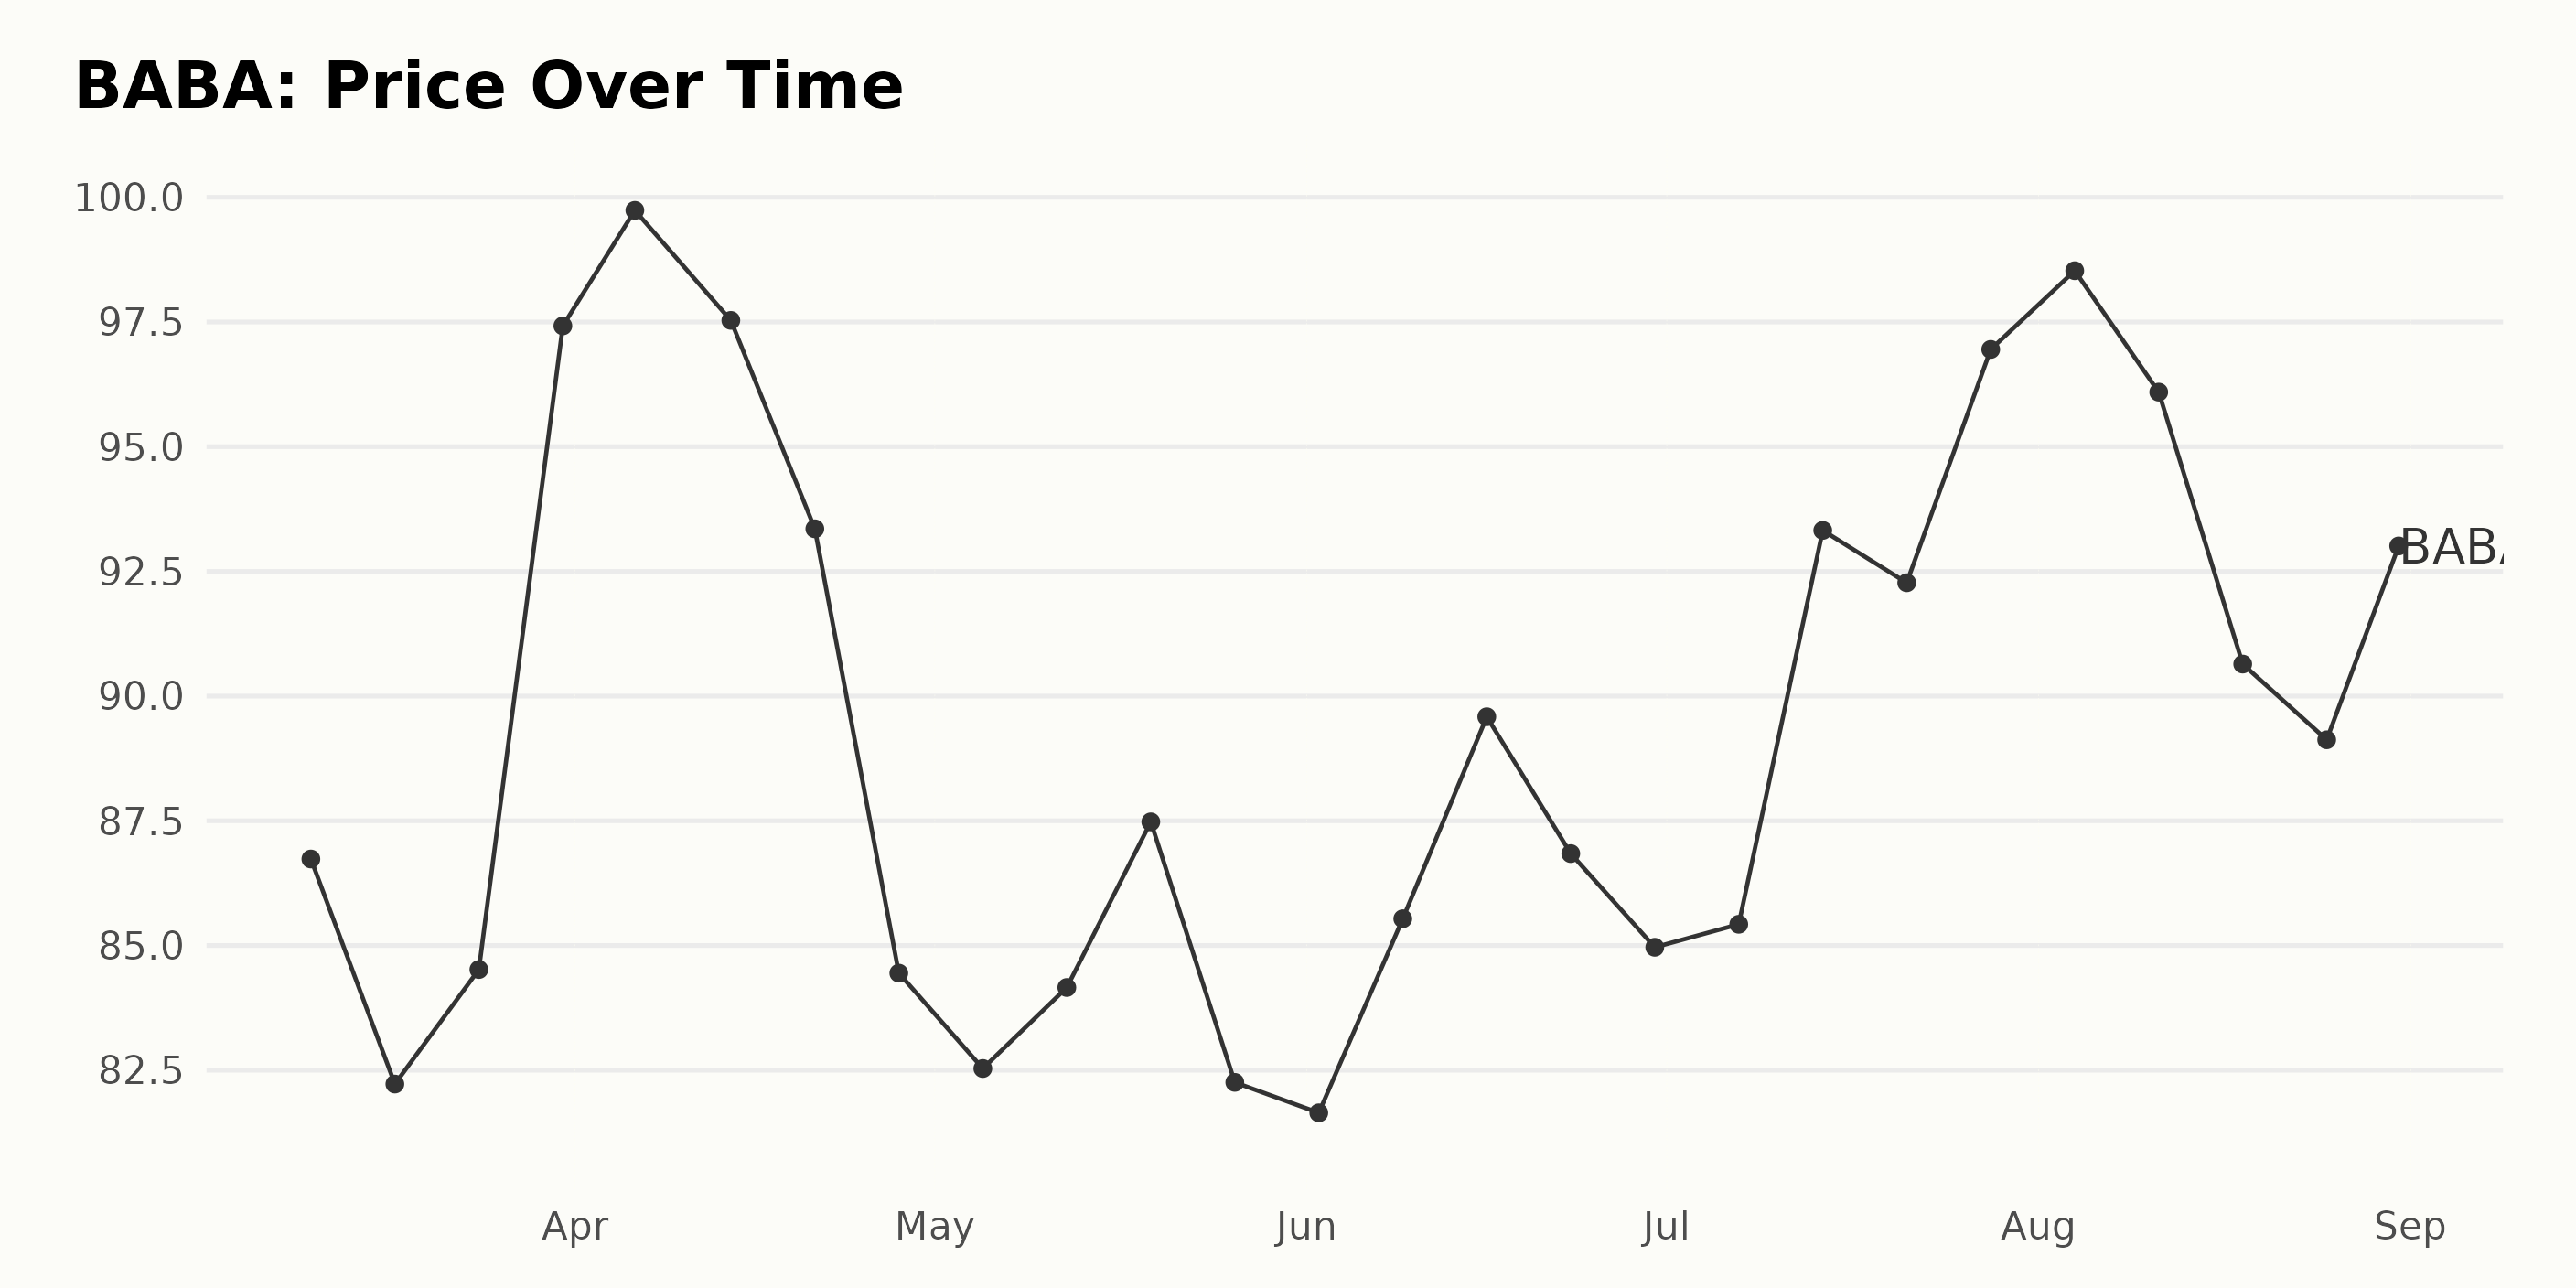
Based on the data provided, the following key points can be noted about the trend and growth rate of BABA:
- On March 10, BABA’s shares were priced at $86.73.
- The price slightly declined to $82.22 by March 17, demonstrating a short-term downward trend in the week following March 10.
- However, by the end of March, the prices went up, reaching $97.42.
- In April, the price fluctuated between $99.74 and $84.44, indicating an inconsistent trend.
- By the start of May, the numbers further reduced to $82.53 but managed to recover back to $87.48 on May 19, only to decrease once again to $82.26 by May 26, suggesting a volatile trend for the month.
- In June, there was a slow upward trend visible, with prices increasing from $81.65 to $89.59. This trend decelerated towards the end of the month, settling down to $84.96 on June 30.
- July showed another swing in the upward direction, with the price peaking at $96.95 by the end of the month.
- Finally, in August, the share price peaked at $98.53 initially, followed by a decline, reaching $92.90 by the end of the month.
In conclusion, the trend for BABA’s share prices exhibits a certain level of volatility with an overall increment pattern throughout the period. There is no clear pattern that can be said to be consistently accelerating or decelerating. The share price fluctuates regularly with ups and downs. Here is a chart of BABA's price over the past 180 days.
Alibaba's Robust Performance: Analyzing Quality, Momentum, and Growth Dimensions
The POWR Ratings grade for BABA reflects its performance within the China category of stocks, which has a total of 45 stocks. Over the period provided (March 11, 2023, to September 1, 2023), there is an observable fluctuation in the BABA's POWR grade and its rank in the China category. Here are some notable insights:
- It shifts between a C (Neutral) grade and a B (Buy) grade over various weeks.
- It received a C (Neutral) grade in nine out of the 27 weeks considered.
- In the latest week, August 31, 2023, it holds a grade of B (Buy).
- In terms of category ranking, lower values denote better ranks. The rank varied significantly over these weeks between #4 and #25.
- On August 19, 2023, the stock achieved its best category rank of #4.
- As of September 1, 2023, it is ranked #9.
Overall, the fluctuations in POWR grade and rank hint at a turbulent performance for BABA within the China category of stocks over the period considered.
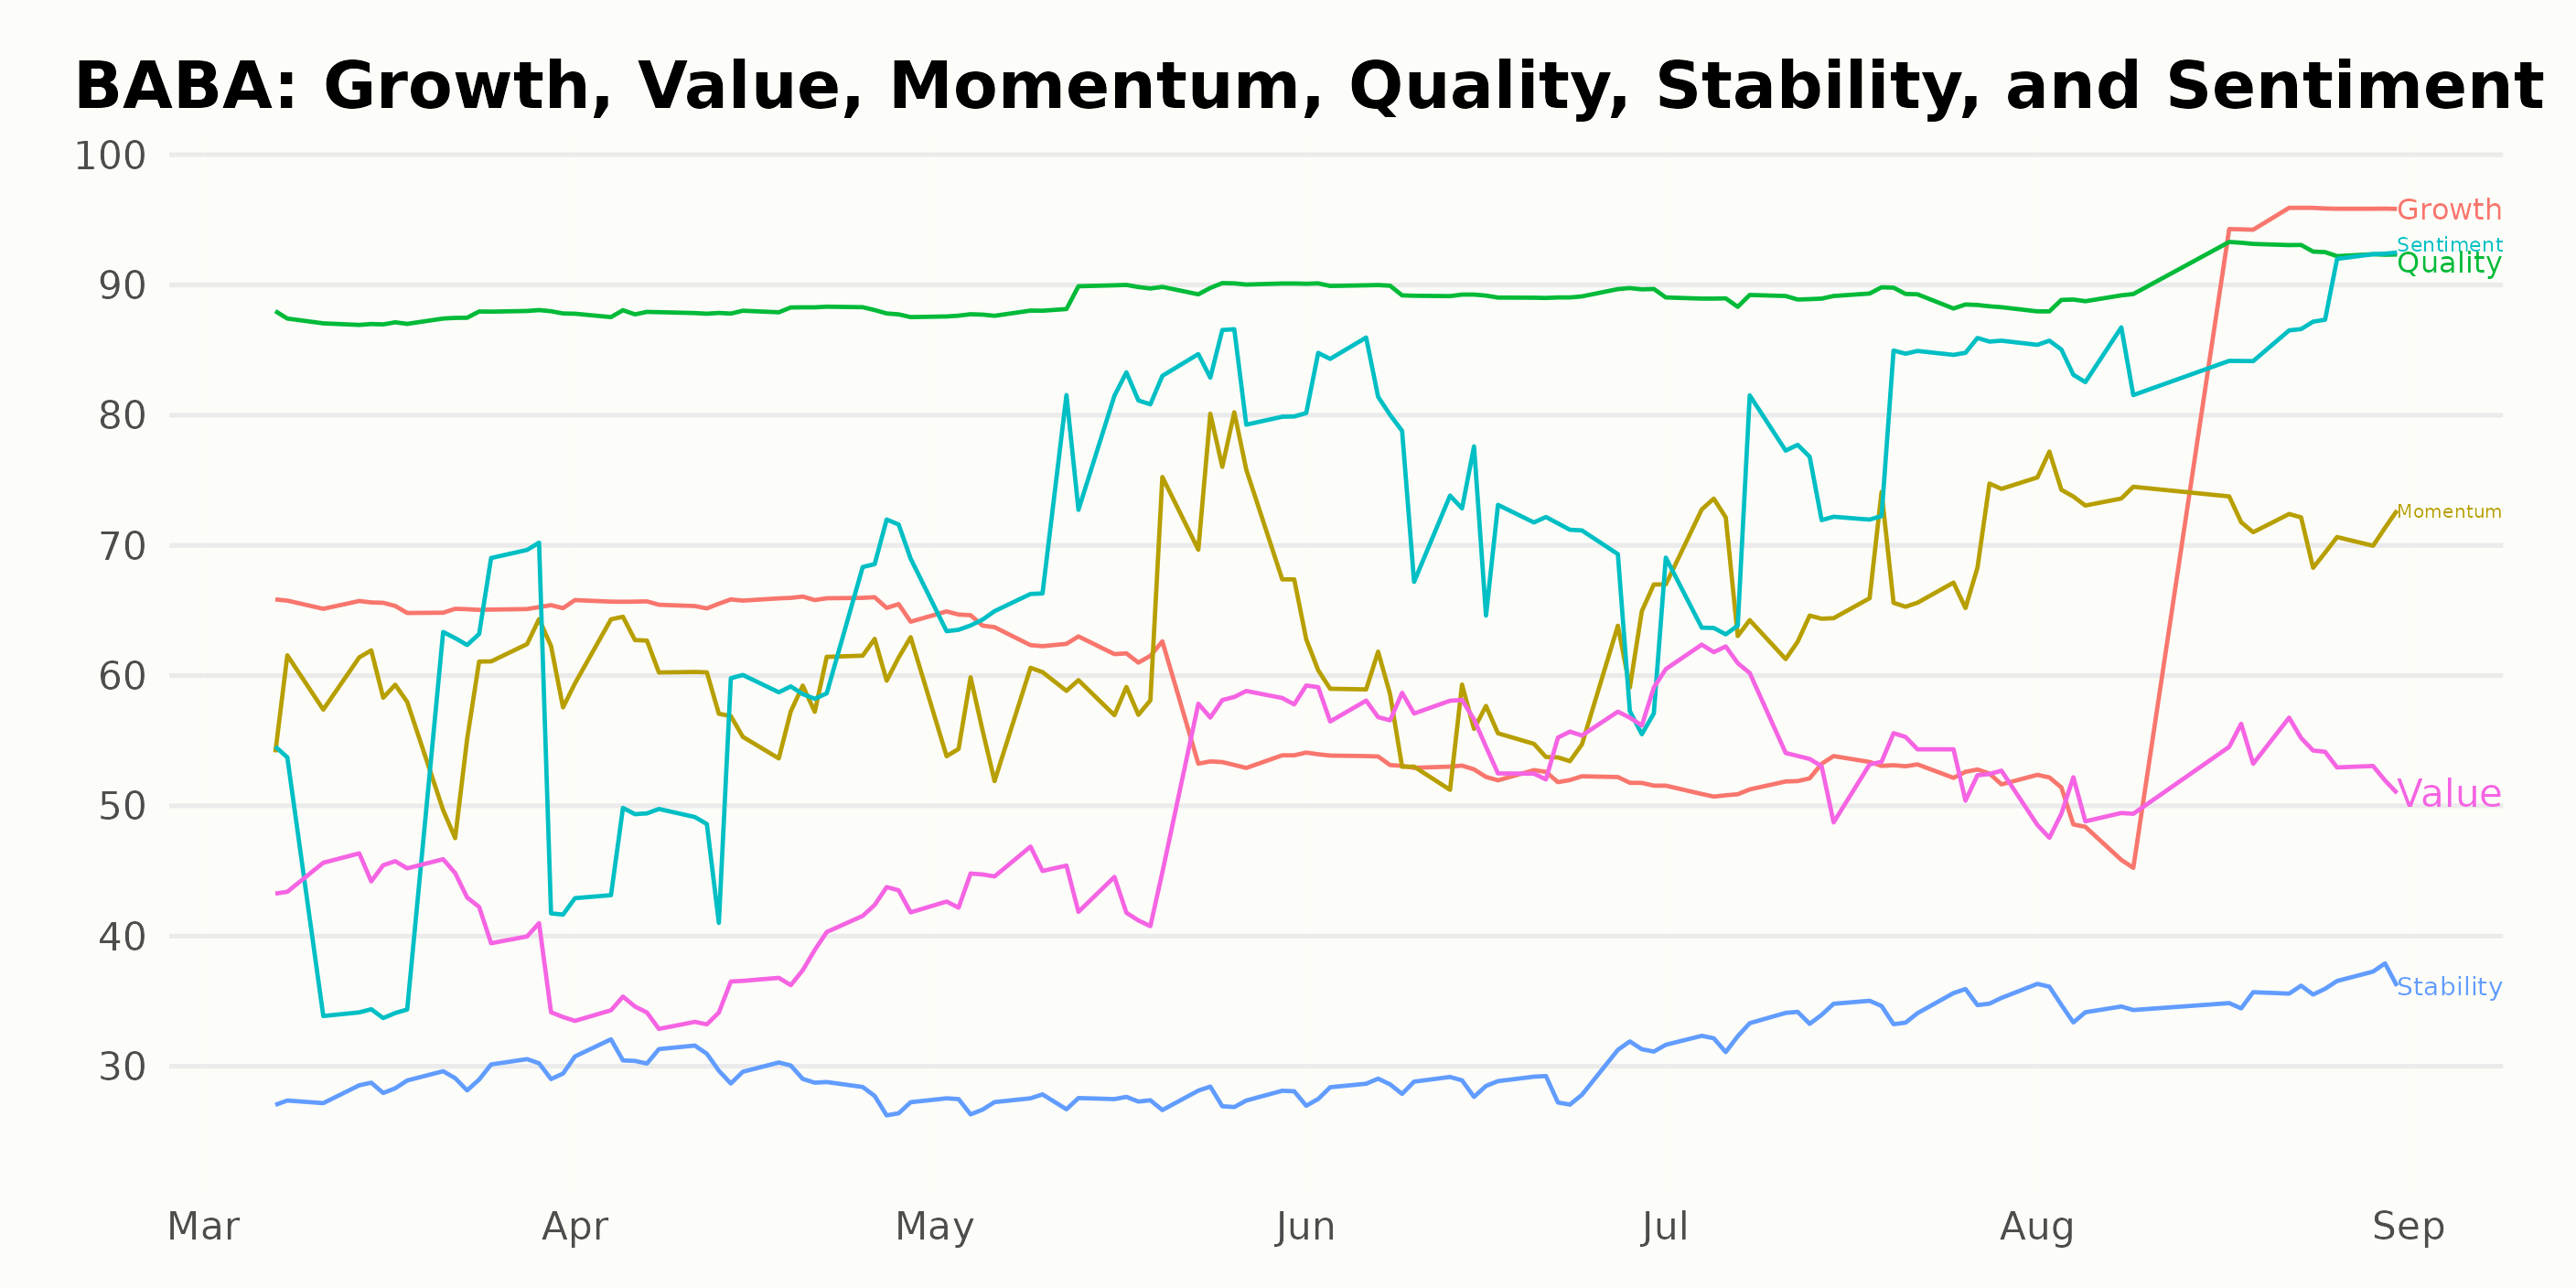
The POWR Ratings for BABA provide insights into the asset's performance across six dimensions. However, we'll focus on the three most noteworthy dimensions, which consistently register the highest ratings. These are Quality, Momentum, and Growth.
- Quality stands out as the dimension with the highest ratings overall observed periods. Starting with a score of 88 in March 2023, it continuously improved to 91 by August 2023.
- Momentum, the second highest-rated dimension, indicated a clear upward trend. This dimension had a value of 58 in March 2023 and experienced a steady increase to peak at 73 by August 2023.
- Growth, despite experiencing some volatility between March 2023 and July 2023, ended on a high note. From an initial score of 65, it fluctuated down to 52 in July 2023 before soaring to 77 in August 2023, displaying a substantial improvement within a single month.
This data suggests that BABA demonstrated overall strong Quality, built Momentum, and saw significant Growth within the time frame from March 2023 to August 2023.
How does Alibaba Group Holding Limited (BABA) Stack Up Against its Peers?
Other stocks in the China sector that may be worth considering are NetEase, Inc. (NTES), X Financial (XYF), and Tarena International, Inc. (TEDU) - they have better POWR Ratings. To explore more China stocks, click here.
What To Do Next?
Discover 10 widely held stocks that our proprietary model shows have tremendous downside potential. Please make sure none of these “death trap” stocks are lurking in your portfolio:
BABA shares were trading at $95.27 per share on Friday morning, up $2.37 (+2.55%). Year-to-date, BABA has gained 8.15%, versus a 18.66% rise in the benchmark S&P 500 index during the same period.
About the Author: Aanchal Sugandh

Aanchal's passion for financial markets drives her work as an investment analyst and journalist. She earned her bachelor's degree in finance and is pursuing the CFA program. She is proficient at assessing the long-term prospects of stocks with her fundamental analysis skills. Her goal is to help investors build portfolios with sustainable returns.
The post Alibaba Group Holding (BABA): Buy or Sell September 2023? appeared first on StockNews.com