Environmental and industrial services company Clean Harbors (NYSE: CLH) met Wall Street’s revenue expectations in Q4 CY2024, with sales up 6.9% year on year to $1.43 billion. Its GAAP profit of $1.55 per share was 15.2% above analysts’ consensus estimates.
Is now the time to buy Clean Harbors? Find out by accessing our full research report, it’s free.
Clean Harbors (CLH) Q4 CY2024 Highlights:
- Revenue: $1.43 billion vs analyst estimates of $1.43 billion (6.9% year-on-year growth, in line)
- EPS (GAAP): $1.55 vs analyst estimates of $1.35 (15.2% beat)
- Adjusted EBITDA: $257.2 million vs analyst estimates of $251.8 million (18% margin, 2.1% beat)
- EBITDA guidance for the upcoming financial year 2025 is $1.18 billion at the midpoint, below analyst estimates of $1.21 billion
- Operating Margin: 9.6%, down from 11% in the same quarter last year
- Free Cash Flow Margin: 16.9%, up from 12.9% in the same quarter last year
- Market Capitalization: $12.49 billion
“Our fourth-quarter results were in line with our expectations as our Environmental Services (ES) segment capped a record 2024 with a robust performance, including the 11th consecutive quarter of year-over-year margin growth,” said Mike Battles, Co-Chief Executive Officer.
Company Overview
Established in 1980, Clean Harbors (NYSE: CLH) provides environmental and industrial services like hazardous and non-hazardous waste disposal and emergency spill cleanups.
Waste Management
Waste management companies can possess licenses permitting them to handle hazardous materials. Furthermore, many services are performed through contracts and statutorily mandated, non-discretionary, or recurring, leading to more predictable revenue streams. However, regulation can be a headwind, rendering existing services obsolete or forcing companies to invest precious capital to comply with new, more environmentally-friendly rules. Lastly, waste management companies are at the whim of economic cycles. Interest rates, for example, can greatly impact industrial production or commercial projects that create waste and byproducts.
Sales Growth
A company’s long-term sales performance can indicate its overall quality. Any business can put up a good quarter or two, but many enduring ones grow for years. Luckily, Clean Harbors’s sales grew at an impressive 11.5% compounded annual growth rate over the last five years. Its growth beat the average industrials company and shows its offerings resonate with customers.
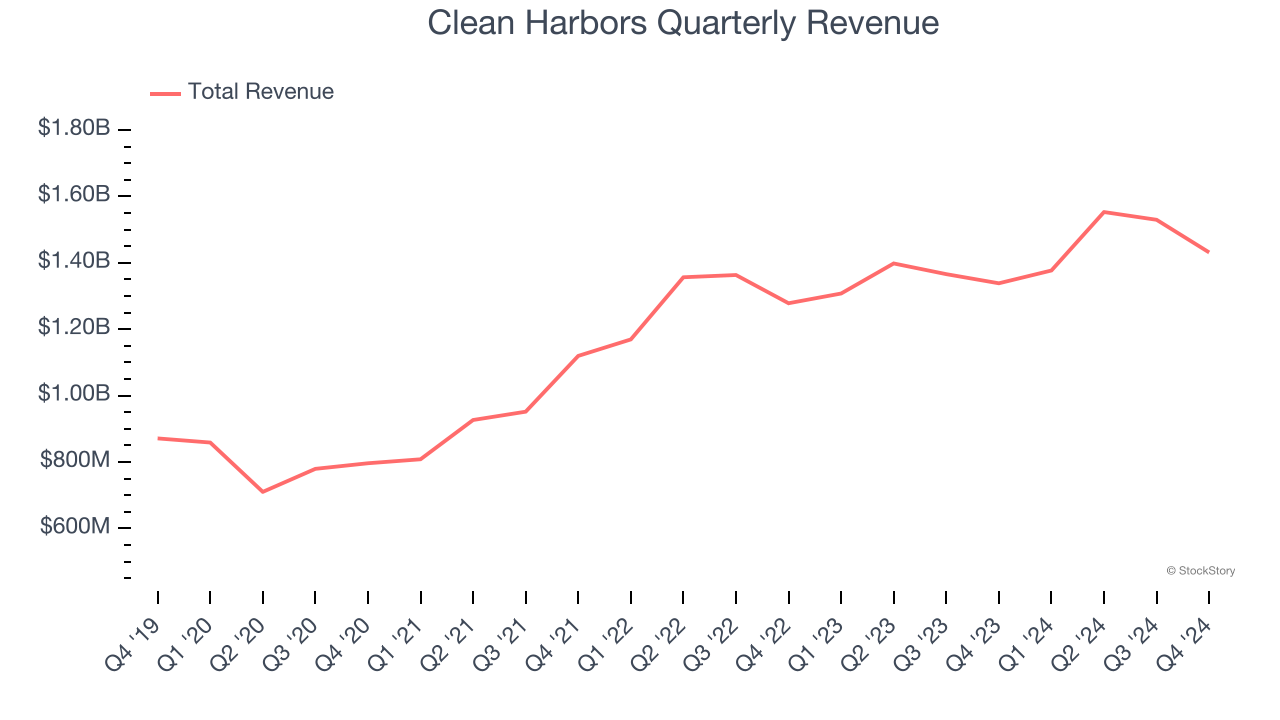
Long-term growth is the most important, but within industrials, a half-decade historical view may miss new industry trends or demand cycles. Clean Harbors’s recent history shows its demand slowed significantly as its annualized revenue growth of 6.8% over the last two years is well below its five-year trend. 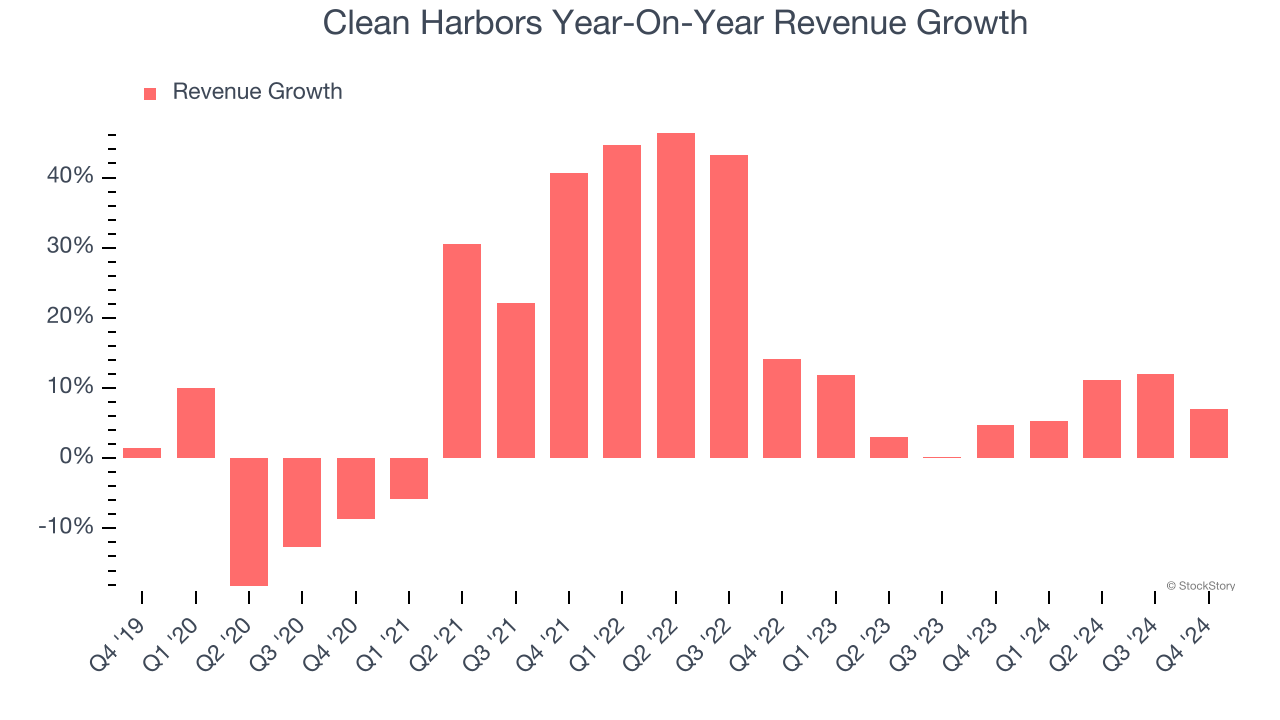
This quarter, Clean Harbors grew its revenue by 6.9% year on year, and its $1.43 billion of revenue was in line with Wall Street’s estimates.
Looking ahead, sell-side analysts expect revenue to grow 5.8% over the next 12 months, similar to its two-year rate. This projection doesn't excite us and suggests its newer products and services will not accelerate its top-line performance yet.
Today’s young investors won’t have read the timeless lessons in Gorilla Game: Picking Winners In High Technology because it was written more than 20 years ago when Microsoft and Apple were first establishing their supremacy. But if we apply the same principles, then enterprise software stocks leveraging their own generative AI capabilities may well be the Gorillas of the future. So, in that spirit, we are excited to present our Special Free Report on a profitable, fast-growing enterprise software stock that is already riding the automation wave and looking to catch the generative AI next.
Operating Margin
Operating margin is a key measure of profitability. Think of it as net income - the bottom line - excluding the impact of taxes and interest on debt, which are less connected to business fundamentals.
Clean Harbors has managed its cost base well over the last five years. It demonstrated solid profitability for an industrials business, producing an average operating margin of 10.7%.
Looking at the trend in its profitability, Clean Harbors’s operating margin rose by 3.4 percentage points over the last five years, as its sales growth gave it operating leverage.
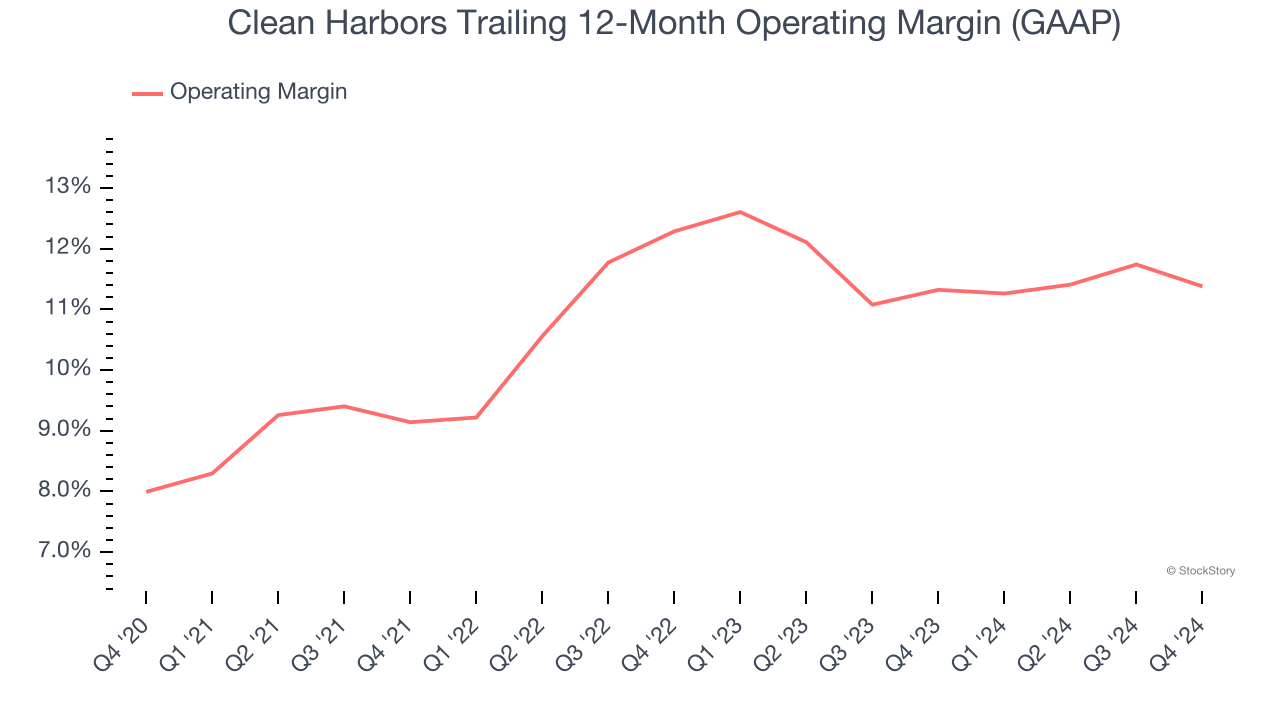
In Q4, Clean Harbors generated an operating profit margin of 9.6%, down 1.4 percentage points year on year. Since Clean Harbors’s operating margin decreased more than its gross margin, we can assume it was recently less efficient because expenses such as marketing, R&D, and administrative overhead increased.
Earnings Per Share
Revenue trends explain a company’s historical growth, but the long-term change in earnings per share (EPS) points to the profitability of that growth – for example, a company could inflate its sales through excessive spending on advertising and promotions.
Clean Harbors’s EPS grew at an astounding 33.6% compounded annual growth rate over the last five years, higher than its 11.5% annualized revenue growth. This tells us the company became more profitable on a per-share basis as it expanded.
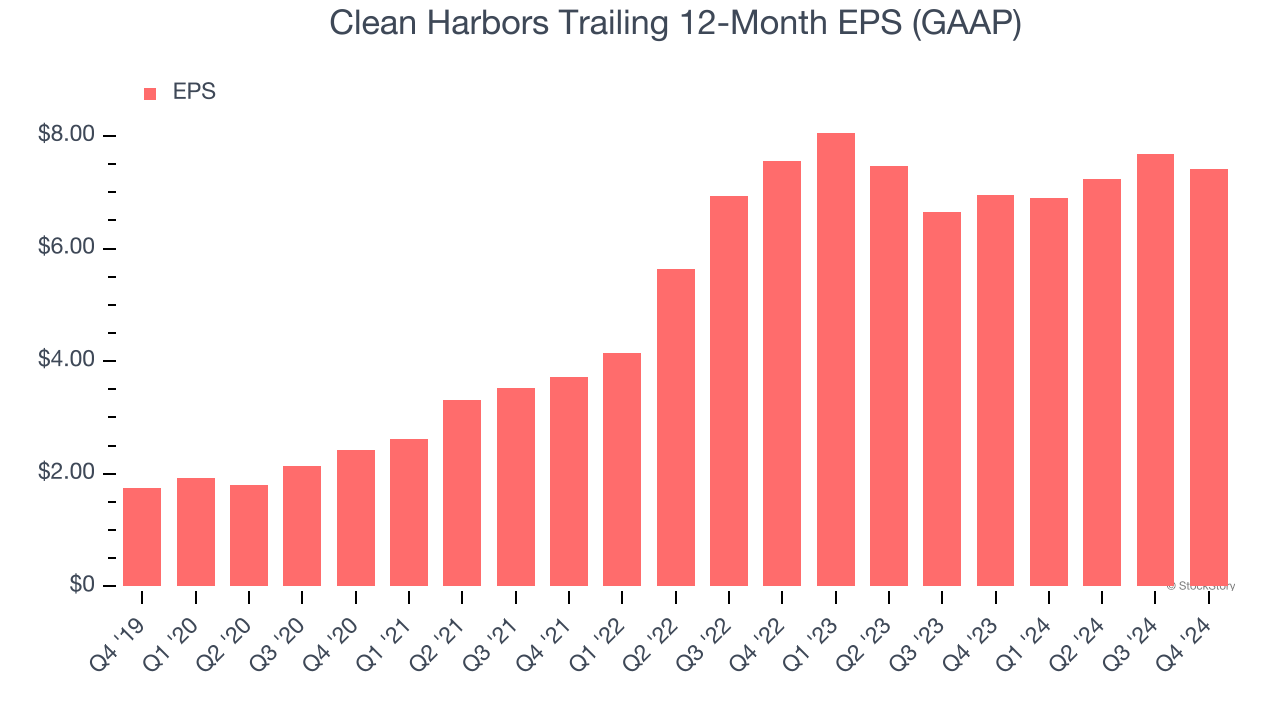
We can take a deeper look into Clean Harbors’s earnings to better understand the drivers of its performance. As we mentioned earlier, Clean Harbors’s operating margin declined this quarter but expanded by 3.4 percentage points over the last five years. Its share count also shrank by 3.5%, and these factors together are positive signs for shareholders because improving profitability and share buybacks turbocharge EPS growth relative to revenue growth. 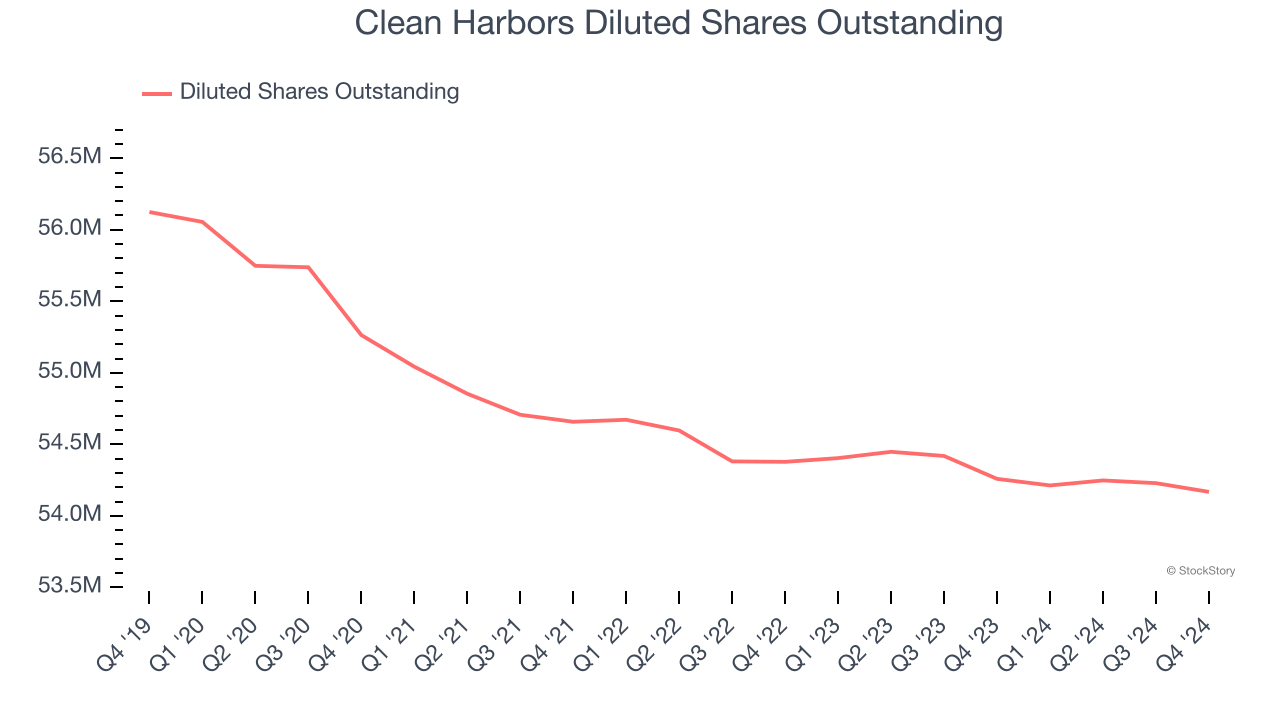
Like with revenue, we analyze EPS over a shorter period to see if we are missing a change in the business.
For Clean Harbors, EPS didn’t budge over the last two years, a regression from its five-year trend. We hope it can revert to earnings growth in the coming years.
In Q4, Clean Harbors reported EPS at $1.55, down from $1.81 in the same quarter last year. Despite falling year on year, this print easily cleared analysts’ estimates. Over the next 12 months, Wall Street expects Clean Harbors’s full-year EPS of $7.42 to grow 10.5%.
Key Takeaways from Clean Harbors’s Q4 Results
We enjoyed seeing Clean Harbors exceed analysts’ EPS and EBITDA expectations this quarter. On the other hand, its full-year EBITDA guidance missed. Zooming out, we think this was a decent quarter featuring some areas of strength but also some blemishes. The stock remained flat at $225.21 immediately following the results.
So should you invest in Clean Harbors right now? The latest quarter does matter, but not nearly as much as longer-term fundamentals and valuation, when deciding if the stock is a buy. We cover that in our actionable full research report which you can read here, it’s free.


