
Fashion conglomerate Oxford Industries (NYSE: OXM) reported Q3 CY2025 results exceeding the market’s revenue expectations, but sales were flat year on year at $307.3 million. On the other hand, next quarter’s revenue guidance of $375 million was less impressive, coming in 4.4% below analysts’ estimates. Its non-GAAP loss of $0.92 per share was 2.4% above analysts’ consensus estimates.
Is now the time to buy Oxford Industries? Find out by accessing our full research report, it’s free for active Edge members.
Oxford Industries (OXM) Q3 CY2025 Highlights:
- Revenue: $307.3 million vs analyst estimates of $305.6 million (flat year on year, 0.6% beat)
- Adjusted EPS: -$0.92 vs analyst estimates of -$0.94 (2.4% beat)
- Revenue Guidance for Q4 CY2025 is $375 million at the midpoint, below analyst estimates of $392.1 million
- Management lowered its full-year Adjusted EPS guidance to $2.30 at the midpoint, a 23.3% decrease
- Operating Margin: -27.7%, down from -2% in the same quarter last year
- Free Cash Flow was -$47.92 million compared to -$56.93 million in the same quarter last year
- Market Capitalization: $591.4 million
Tom Chubb, Chairman and CEO, commented, “Our third quarter results came in as expected and reflect the disciplined execution across our brands in a highly competitive and promotional environment. While we witnessed pockets of strength within our businesses, consumers have become increasingly choiceful, especially with respect to the more discretionary aspects of their wardrobe. As we entered the holiday season, our customers have been highly value-driven, seeking both compelling promotions and new, innovative products."
Company Overview
The parent company of Tommy Bahama, Oxford Industries (NYSE: OXM) is a lifestyle fashion conglomerate with brands that embody outdoor happiness.
Revenue Growth
A company’s long-term performance is an indicator of its overall quality. Any business can have short-term success, but a top-tier one grows for years. Over the last five years, Oxford Industries grew its sales at a 12.6% annual rate. Although this growth is acceptable on an absolute basis, it fell short of our standards for the consumer discretionary sector, which enjoys a number of secular tailwinds.
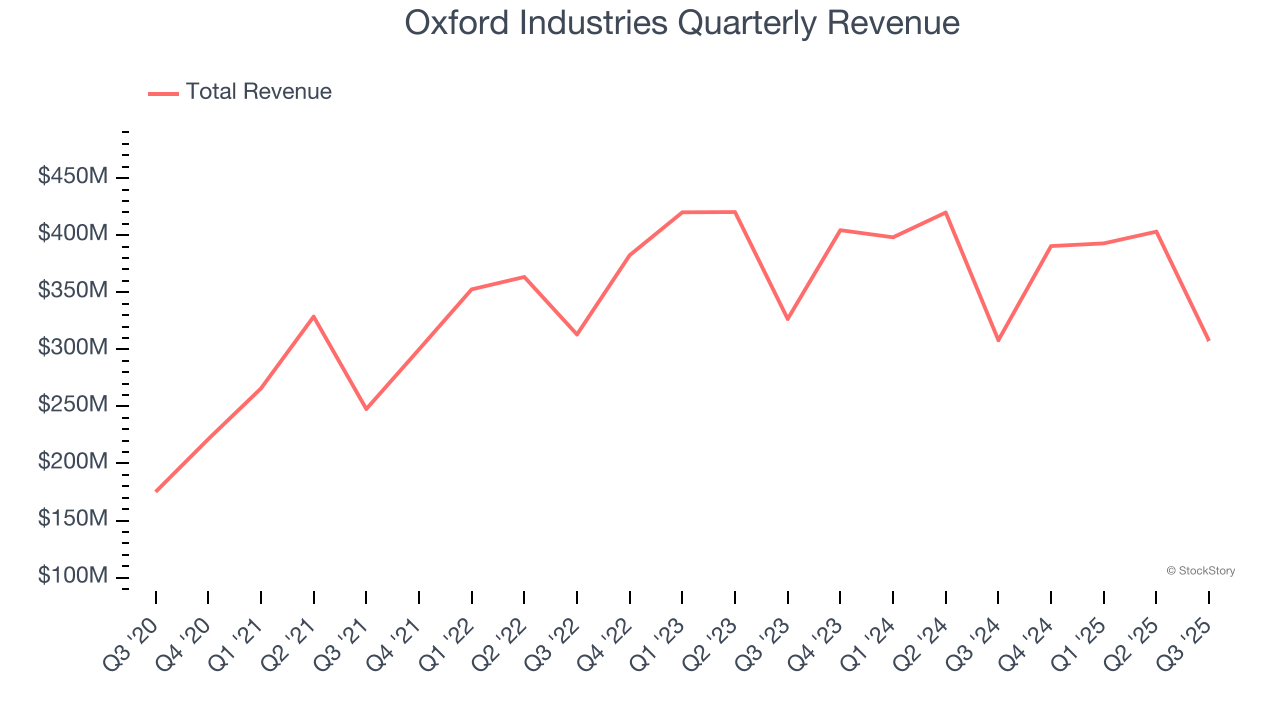
We at StockStory place the most emphasis on long-term growth, but within consumer discretionary, a stretched historical view may miss a company riding a successful new product or trend. Oxford Industries’s performance shows it grew in the past but relinquished its gains over the last two years, as its revenue fell by 1.8% annually. 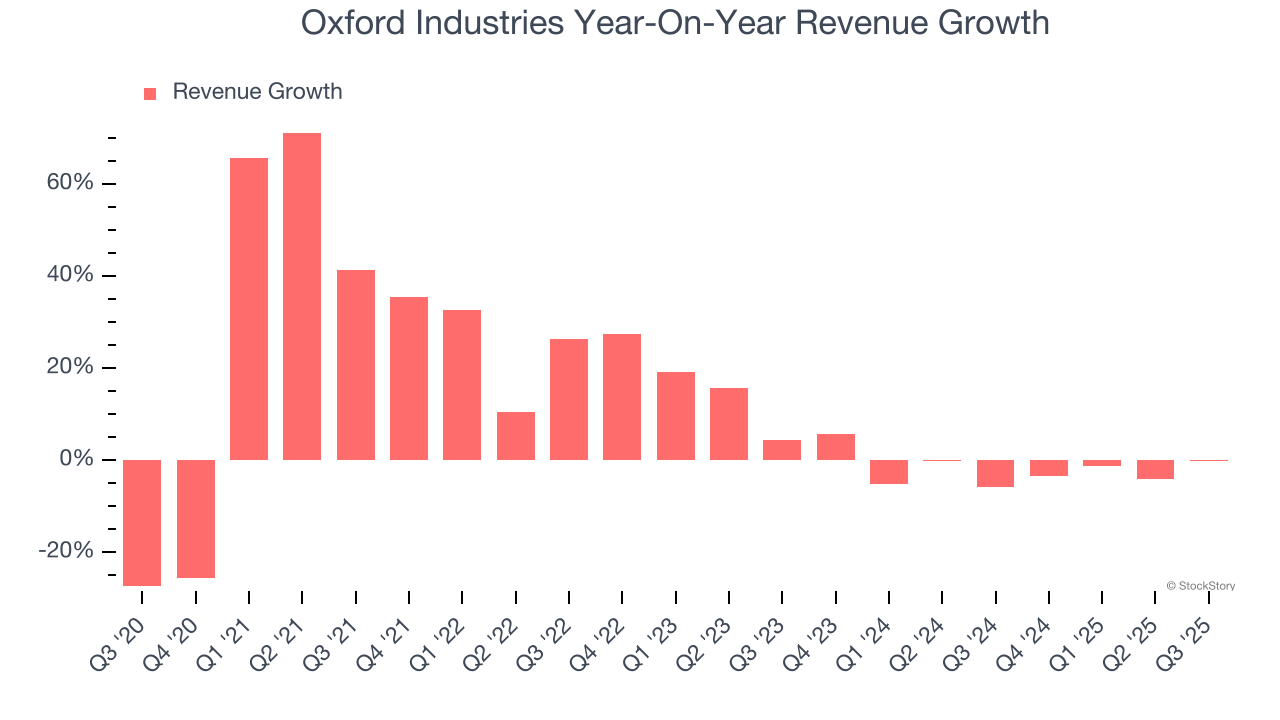
This quarter, Oxford Industries’s $307.3 million of revenue was flat year on year but beat Wall Street’s estimates by 0.6%. Company management is currently guiding for a 4% year-on-year decline in sales next quarter.
Looking further ahead, sell-side analysts expect revenue to grow 2% over the next 12 months. Although this projection implies its newer products and services will spur better top-line performance, it is still below average for the sector.
Software is eating the world and there is virtually no industry left that has been untouched by it. That drives increasing demand for tools helping software developers do their jobs, whether it be monitoring critical cloud infrastructure, integrating audio and video functionality, or ensuring smooth content streaming. Click here to access a free report on our 3 favorite stocks to play this generational megatrend.
Operating Margin
Operating margin is a key measure of profitability. Think of it as net income - the bottom line - excluding the impact of taxes and interest on debt, which are less connected to business fundamentals.
Oxford Industries’s operating margin has been trending down over the last 12 months, and it ended up breaking even over the last two years. The company’s performance was inadequate, showing its operating expenses were rising and it couldn’t pass those costs onto its customers.
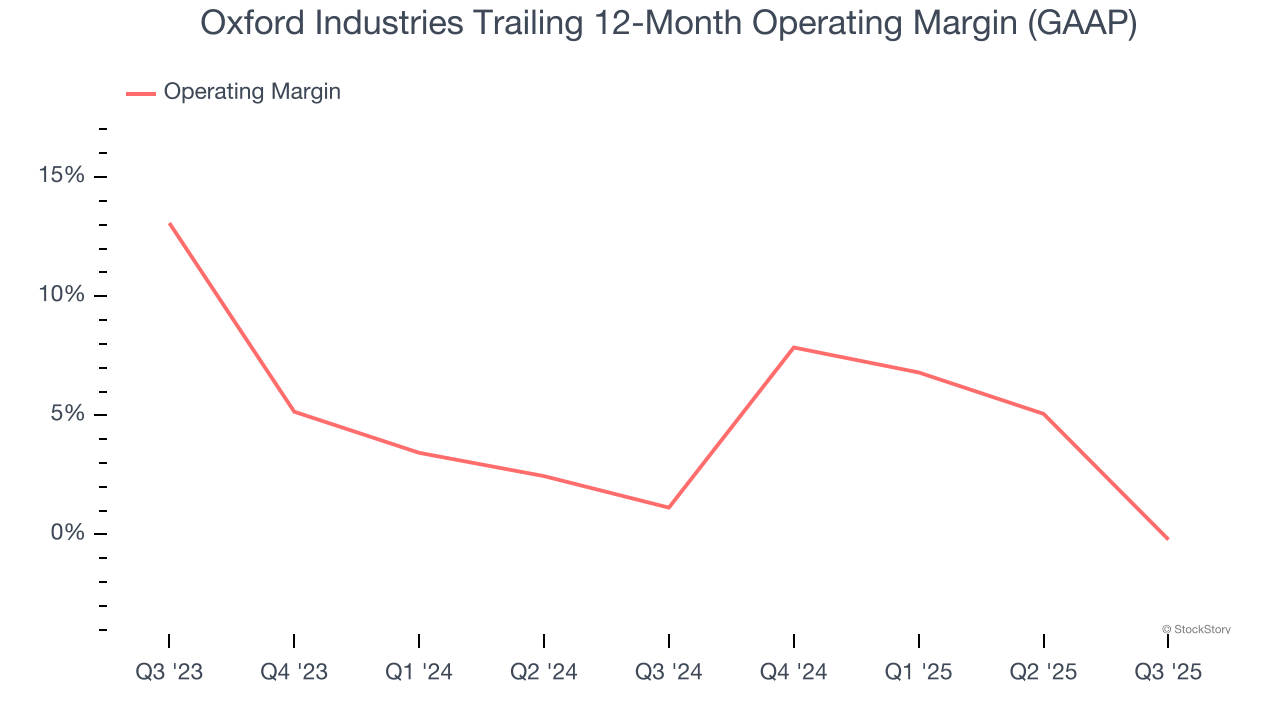
In Q3, Oxford Industries generated an operating margin profit margin of negative 27.7%, down 25.7 percentage points year on year. This contraction shows it was less efficient because its expenses increased relative to its revenue.
Earnings Per Share
We track the long-term change in earnings per share (EPS) for the same reason as long-term revenue growth. Compared to revenue, however, EPS highlights whether a company’s growth is profitable.
Oxford Industries’s full-year EPS flipped from negative to positive over the last five years. This is encouraging and shows it’s at a critical moment in its life.
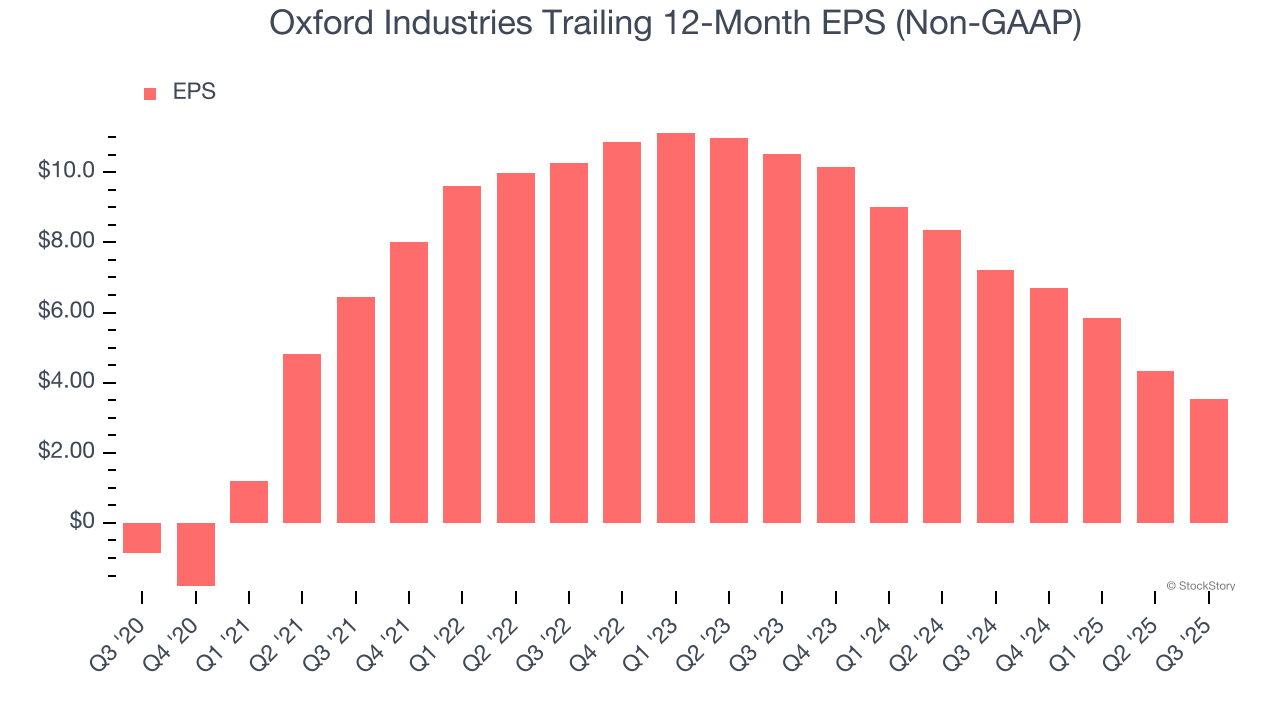
In Q3, Oxford Industries reported adjusted EPS of negative $0.92, down from negative $0.11 in the same quarter last year. Despite falling year on year, this print beat analysts’ estimates by 2.4%. Over the next 12 months, Wall Street expects Oxford Industries’s full-year EPS of $3.53 to grow 2.3%.
Key Takeaways from Oxford Industries’s Q3 Results
We struggled to find many positives in these results. Its full-year EPS guidance missed and its EPS guidance for next quarter fell short of Wall Street’s estimates. Overall, this quarter could have been better. The stock traded down 19.7% to $32.50 immediately after reporting.
Oxford Industries underperformed this quarter, but does that create an opportunity to invest right now? What happened in the latest quarter matters, but not as much as longer-term business quality and valuation, when deciding whether to invest in this stock. We cover that in our actionable full research report which you can read here, it’s free for active Edge members.


