
Content production and distribution company Sphere Entertainment (NYSE: SPHR) missed Wall Street’s revenue expectations in Q3 CY2025, but sales rose 15.2% year on year to $262.5 million. Its GAAP loss of $2.80 per share was significantly below analysts’ consensus estimates.
Is now the time to buy Sphere Entertainment? Find out by accessing our full research report, it’s free for active Edge members.
Sphere Entertainment (SPHR) Q3 CY2025 Highlights:
- Revenue: $262.5 million vs analyst estimates of $320 million (15.2% year-on-year growth, 18% miss)
- EPS (GAAP): -$2.80 vs analyst estimates of -$0.93 (significant miss)
- Adjusted EBITDA: -$205.3 million vs analyst estimates of $25.94 million (-78.2% margin, significant miss)
- Operating Margin: -49.4%, in line with the same quarter last year
- Market Capitalization: $2.39 billion
Executive Chairman and CEO James L. Dolan said, “The Wizard of Oz at Sphere, which is the best example to-date of experiential storytelling in this new medium, has been met with strong consumer demand. Looking ahead, we believe our Company is well positioned for long-term growth as we continue to execute on our global vision for Sphere.”
Company Overview
Famous for its viral Las Vegas Sphere venue, Sphere Entertainment (NYSE: SPHR) hosts live entertainment events and distributes content across various media platforms.
Revenue Growth
A company’s long-term sales performance can indicate its overall quality. Any business can put up a good quarter or two, but the best consistently grow over the long haul. Over the last five years, Sphere Entertainment grew its sales at a sluggish 8.5% compounded annual growth rate. This fell short of our benchmark for the consumer discretionary sector and is a rough starting point for our analysis.
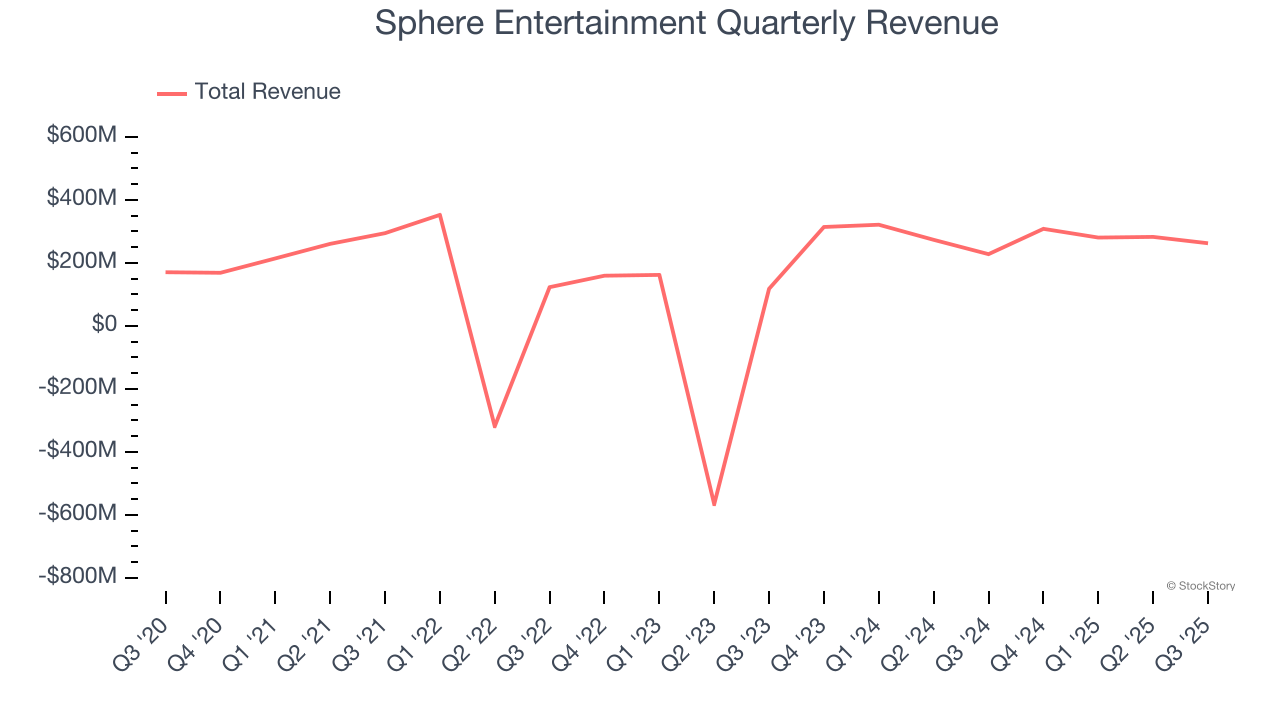
Long-term growth is the most important, but within consumer discretionary, product cycles are short and revenue can be hit-driven due to rapidly changing trends and consumer preferences. Sphere Entertainment’s annualized revenue growth of 232% over the last two years is above its five-year trend, suggesting its demand recently accelerated. Note that COVID hurt Sphere Entertainment’s business in 2020 and part of 2021, and it bounced back in a big way thereafter. 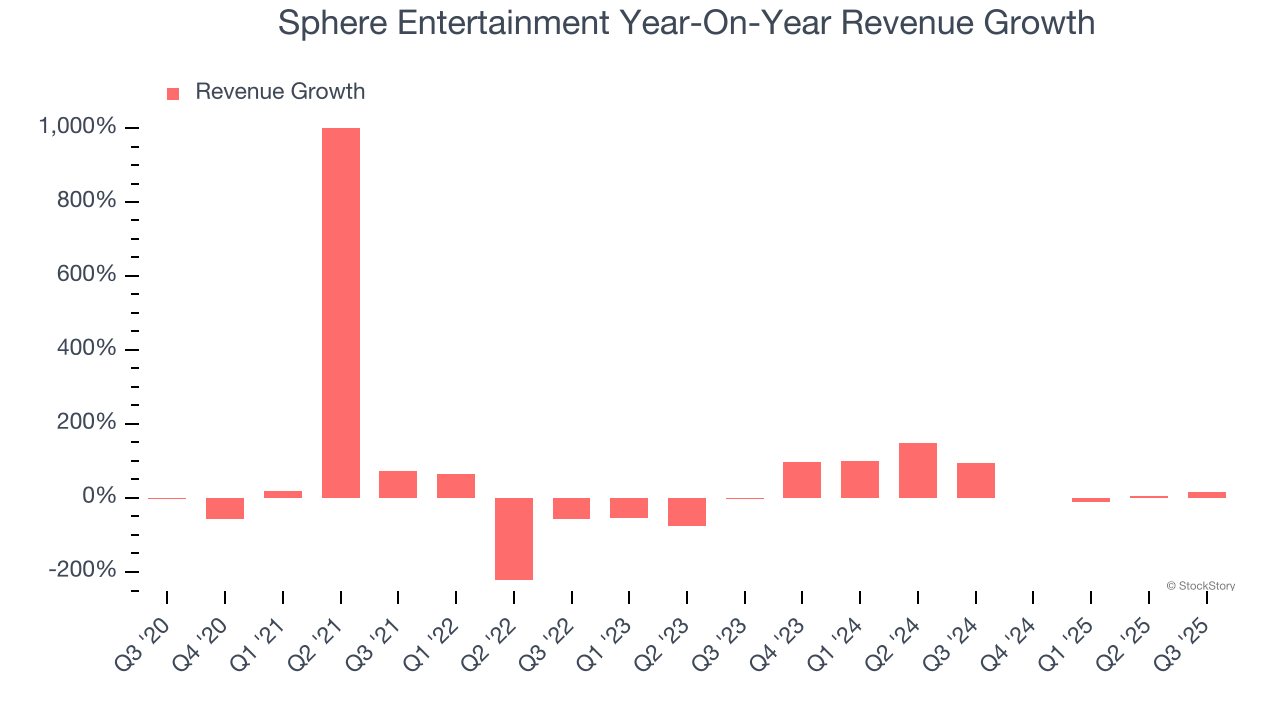
We can better understand the company’s revenue dynamics by analyzing its most important segments, Sphere and MSG Networks, which are 66.3% and 33.7% of revenue. Over the last two years, Sphere Entertainment’s Sphere revenue (live events and advertising) averaged 15.2% year-on-year growth. On the other hand, its MSG Networks revenue (content distribution) averaged 14.4% declines. 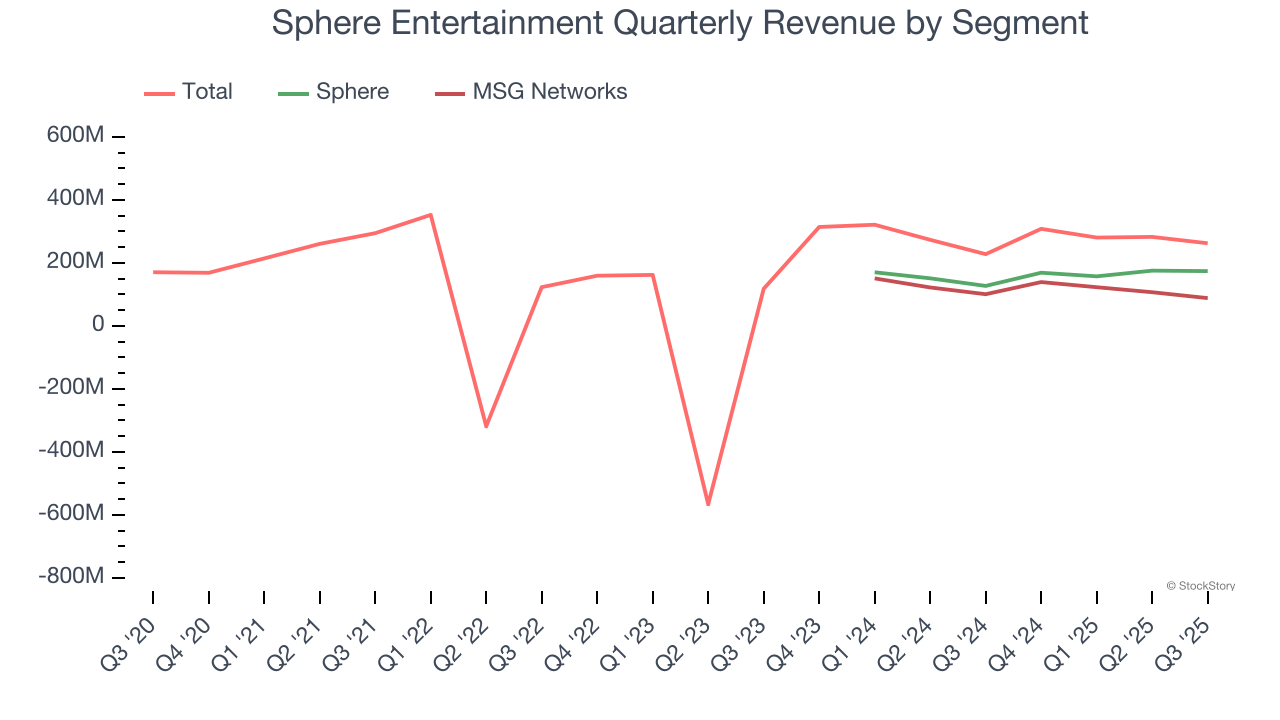
This quarter, Sphere Entertainment’s revenue grew by 15.2% year on year to $262.5 million but fell short of Wall Street’s estimates.
Looking ahead, sell-side analysts expect revenue to grow 10% over the next 12 months, a deceleration versus the last two years. This projection is underwhelming and indicates its products and services will face some demand challenges.
Microsoft, Alphabet, Coca-Cola, Monster Beverage—all began as under-the-radar growth stories riding a massive trend. We’ve identified the next one: a profitable AI semiconductor play Wall Street is still overlooking. Go here for access to our full report.
Operating Margin
Operating margin is a key measure of profitability. Think of it as net income - the bottom line - excluding the impact of taxes and interest on debt, which are less connected to business fundamentals.
Sphere Entertainment’s operating margin has shrunk over the last 12 months and averaged negative 28.5% over the last two years. Unprofitable consumer discretionary companies with falling margins deserve extra scrutiny because they’re spending loads of money to stay relevant, an unsustainable practice.
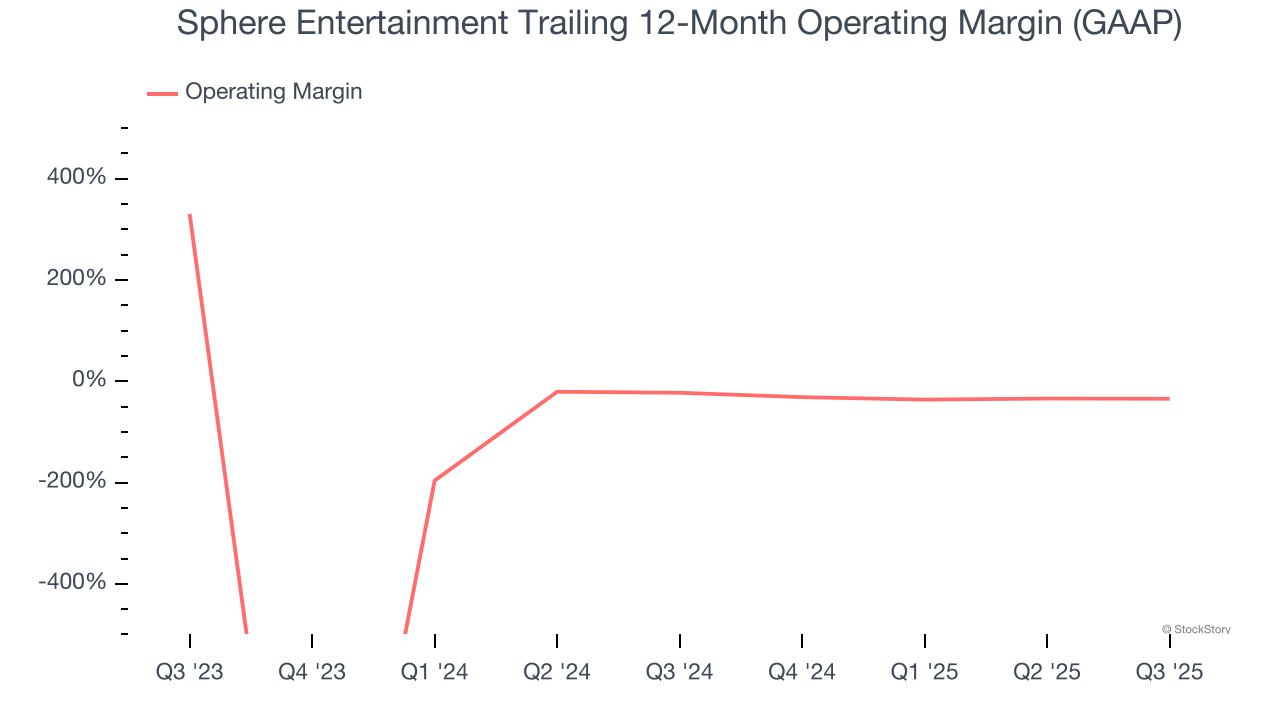
This quarter, Sphere Entertainment generated a negative 49.4% operating margin. The company's consistent lack of profits raise a flag.
Earnings Per Share
Revenue trends explain a company’s historical growth, but the long-term change in earnings per share (EPS) points to the profitability of that growth – for example, a company could inflate its sales through excessive spending on advertising and promotions.
Sphere Entertainment’s earnings losses deepened over the last five years as its EPS dropped 50.8% annually. We tend to steer our readers away from companies with falling EPS, where diminishing earnings could imply changing secular trends and preferences. Consumer Discretionary companies are particularly exposed to this, and if the tide turns unexpectedly, Sphere Entertainment’s low margin of safety could leave its stock price susceptible to large downswings.
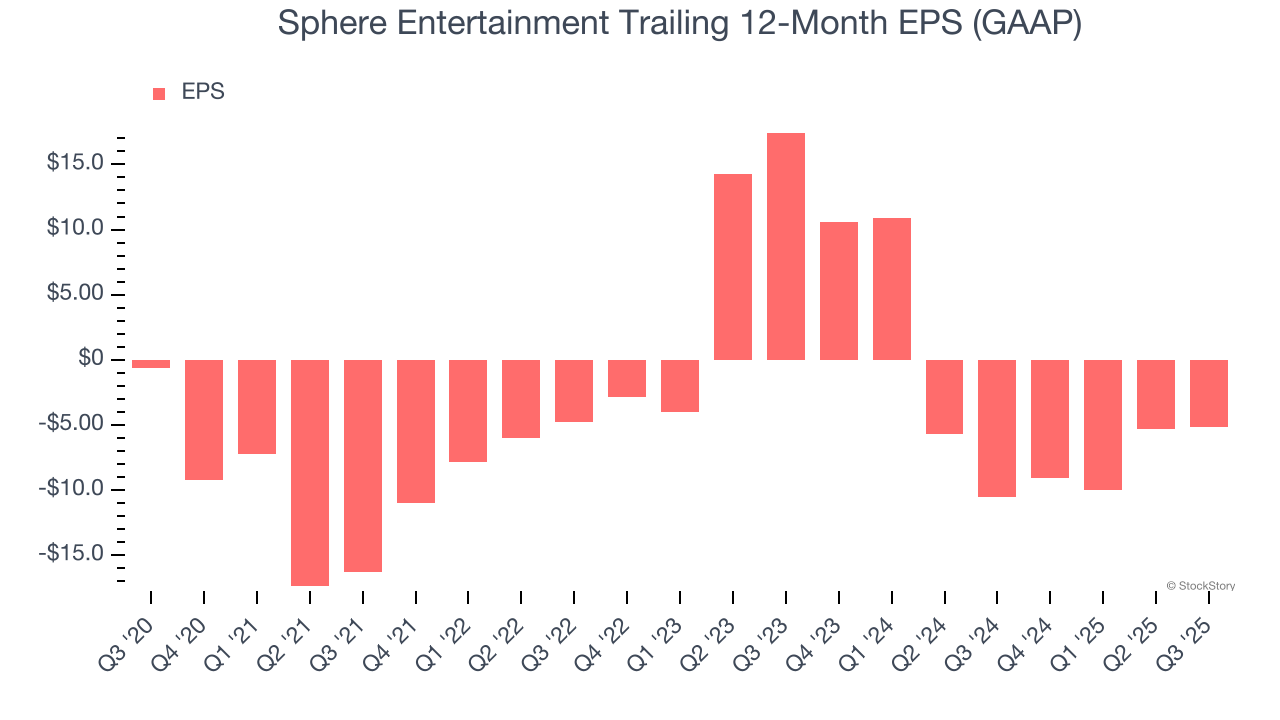
In Q3, Sphere Entertainment reported EPS of negative $2.80, up from negative $2.95 in the same quarter last year. Despite growing year on year, this print missed analysts’ estimates. We also like to analyze expected EPS growth based on Wall Street analysts’ consensus projections, but there is insufficient data.
Key Takeaways from Sphere Entertainment’s Q3 Results
We struggled to find many positives in these results. Its revenue missed and EPS both fell short of Wall Street’s estimates by large amounts. Overall, this quarter could have been better. The stock traded down 7% to $61.60 immediately after reporting.
Sphere Entertainment’s latest earnings report disappointed. One quarter doesn’t define a company’s quality, so let’s explore whether the stock is a buy at the current price. What happened in the latest quarter matters, but not as much as longer-term business quality and valuation, when deciding whether to invest in this stock. We cover that in our actionable full research report which you can read here, it’s free for active Edge members.


