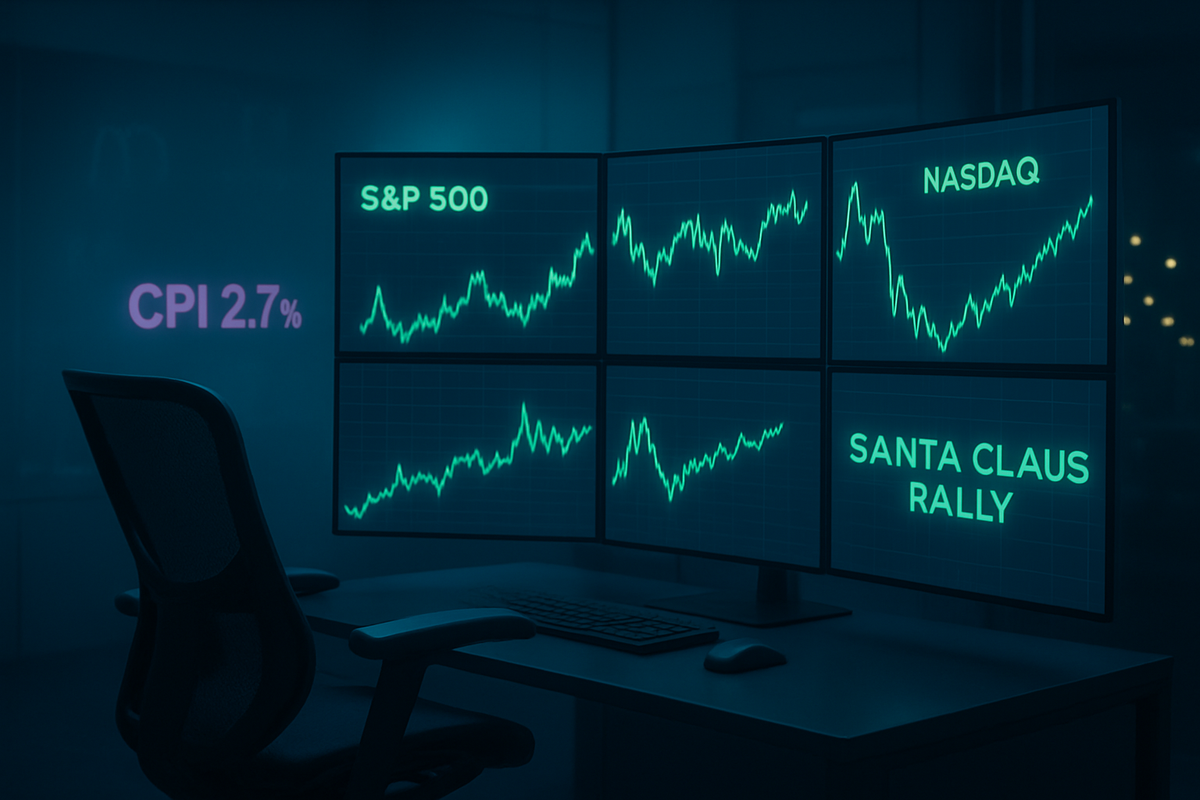
As the final week of 2025 unfolds, Wall Street finds itself navigating a "liquidity vacuum" where the absence of corporate earnings has left the market’s steering wheel entirely in the hands of macro sentiment and stock futures. With the S&P 500 (INDEXSP:.INX) hovering near record highs of 6,932.05, the traditional "Santa Claus Rally" is in full swing, yet the underlying price action remains eerily detached from fundamental company updates. Instead, the tape is being driven by a cocktail of cooling inflation data, the lingering echoes of the Federal Reserve’s December rate cut, and algorithmic trading that thrives in the thin holiday volume.
The current environment, typical of the period between Christmas and New Year’s Day, has turned the market into a high-sensitivity zone where minor shifts in futures contracts can trigger outsized moves in the major indices. Without the "anchor" of quarterly reports from heavyweights like Apple Inc. (NASDAQ: AAPL) or Microsoft Corp. (NASDAQ: MSFT), investors are hyper-fixated on the technical "path of least resistance," which has skewed bullish despite a backdrop of falling consumer confidence and looming 2026 policy anxieties.
The Mechanics of a Thin Market
The final week of 2025 has been defined by a dramatic drop in trading volume, with daily turnover falling to roughly 45% of its annual average. This "thin market" effect has created a scenario where the order book—the collection of buy and sell orders—is remarkably shallow. In this environment, institutional desks are minimally staffed, leaving the field open for high-frequency trading algorithms and retail speculators. The result is a series of "phantom" price moves; on December 26th and 27th, the Nasdaq Composite (INDEXNASDAQ: .IXIC) saw sudden 0.5% spikes within minutes, triggered not by news, but by the mechanical execution of buy-stop orders in a market devoid of sellers.
This sensitivity was amplified by the Federal Reserve’s final meeting of the year on December 10, where Chair Jerome Powell delivered what analysts have dubbed a "hawkish cut." By lowering the federal funds rate by 25 basis points to a range of 3.50%–3.75%, the Fed provided the liquidity necessary to sustain the year-end rally. However, the internal division within the board—with three dissenters favoring a hold due to "sticky" service inflation—has left the market in a state of nervous anticipation. In the absence of earnings to provide a counter-narrative, every minor economic data point, such as the December 18 CPI report showing inflation cooling to 2.7%, is being treated as a monumental shift in the "soft landing" thesis.
The timeline leading to this week’s macro-dominance was further complicated by the "Great Data Gap" earlier in the fall, caused by a 43-day government shutdown. As government agencies scrambled to release backlogged economic indicators throughout December, the market was forced to digest a compressed schedule of data. This "data dump" has replaced the usual earnings season rhythm, forcing traders to focus on macro-aggregates rather than micro-performances. Consequently, the tape this week is being led by S&P 500 E-mini futures, which have set a bullish tone in overnight sessions that the cash market has struggled to fill due to the lack of liquidity.
Sector Sensitivity: Winners and Losers in a Macro Vacuum
In this earnings-free environment, the "AI Supercycle" remains the primary beneficiary of macro-driven momentum. Nvidia Corp. (NASDAQ: NVDA) recently achieved a historic $5 trillion market capitalization, as investors use the holiday lull to rotate capital into the most resilient growth stories of 2025. Without new earnings data to challenge its valuation, Nvidia has drifted higher on the general sentiment that the "Blackwell Ultra" architecture will dominate 2026. Similarly, high-beta tech names like Tesla Inc. (NASDAQ: TSLA) have seen exaggerated gains as lower interest rates disproportionately benefit growth-oriented valuations in a low-volume environment.
Conversely, the retail and industrial sectors are showing signs of "macro-stress" that are being masked by the broader index gains. Walmart Inc. (NYSE: WMT) and Target Corp. (NYSE: TGT) have faced downward pressure in futures markets as traders react to the Conference Board’s Consumer Confidence Index, which fell to a five-month low of 89.1 in December. Investors are increasingly wary of "tariff anxiety"—the fear that 2026 will bring aggressive new import taxes that could squeeze margins for major importers. In a week without earnings calls to provide management guidance on these risks, the market is pricing in a worst-case scenario for these sectors.
The financial sector, led by JPMorgan Chase & Co. (NYSE: JPM), has also experienced heightened volatility. While the Fed’s rate cut generally supports lending activity, the "hawkish" tone regarding 2026 has flattened the yield curve. Without specific guidance from bank executives, the sector is trading purely on the basis of Treasury yield movements. Banks are currently caught in a tug-of-war between the immediate benefit of a "Santa Claus Rally" and the long-term concern that the Fed may pause its easing cycle sooner than expected in 2026.
Broader Significance and Historical Precedents
The current market sensitivity is a textbook example of the "force multiplier" effect seen in holiday trading. Historically, the final week of the year has a 78% probability of being positive, but the 2025 version is unique due to the transition from "inflation fighting" to "policy watching." The market is no longer just looking at whether prices are coming down; it is looking at the "Tariff Wall" of 2026. This shift mirrors the late-2018 period, where low liquidity weaponized a panic over Fed policy, leading to a "Christmas Crash." Fortunately, 2025 has avoided a crash, but the "gappy" price action suggests that the market is just one negative headline away from a sharp reversal.
Furthermore, this event highlights the growing "industrialization of AI" as a macro driver. In previous years, the final week was often driven by retail sales data or energy prices. In 2025, the market is treating AI capital expenditure as a macro-economic indicator in its own right. The movement of the "Magnificent Seven" now dictates the direction of the entire market more than any single economic report, creating a top-heavy index that is highly susceptible to shifts in institutional "greed" levels, which currently sit in the 55–59 range on the Fear & Greed Index.
Regulatory implications also loom large. With Jerome Powell’s term as Fed Chair set to end in May 2026, the current macro sensitivity is partly a reflection of "succession anxiety." Markets are using the low-volume period to speculate on a more politically aligned successor who might succumb to pressure for lower rates ahead of the 2026 midterms. This speculative fever is filling the void that would normally be occupied by discussions of corporate dividends and buyback programs.
The Road to 2026: Pivots and Scenarios
Looking ahead to the first quarter of 2026, the market will likely undergo a "volatility reset" as institutional traders return to their desks and volume normalizes. The immediate challenge will be the "January Effect," where tax-related selling in the first few days of the month could collide with the "Tariff Wall" narrative. Companies will be forced to move from the macro-driven "ghost tape" of late December to the hard reality of Q4 earnings calls in mid-January, where they must provide concrete guidance on how they will navigate potential trade disruptions.
Strategic pivots are already appearing on the horizon. If the macro sentiment remains dominated by tariff fears, we may see a "K-shaped" recovery in 2026, where software-heavy tech companies continue to flourish while hardware and retail firms struggle with supply chain costs. Investors should prepare for a shift from "passive index tracking" to "active sector rotation" as the broad-based rally of late 2025 gives way to a more discerning market environment.
Potential scenarios for the next 90 days range from a "melt-up" fueled by the AI execution phase to a "policy shock" if the Fed’s lone projected 2026 rate cut proves insufficient to prevent a labor market cooling. The current 4.6% unemployment rate—the highest since 2021—suggests that the "soft landing" is not yet guaranteed. The transition from a thin, macro-driven holiday market to a high-volume, earnings-driven January will be the ultimate test of the 2025 rally’s staying power.
Final Assessment: The Last Word on 2025
The final week of 2025 serves as a reminder that in the absence of corporate news, the market is a psychological construct driven by liquidity and expectations. The "Santa Claus Rally" has successfully pushed indices to record heights, but the low-volume "ghost tape" masks a growing divergence between record-breaking stock prices and cooling consumer confidence. The key takeaway for investors is that while the current momentum is positive, it is also fragile, built on a foundation of thin liquidity and automated trading.
As we move into 2026, the focus will shift from the "relief rally" of late 2025 to the "execution reality" of the coming year. Investors should watch for the return of institutional volume in the first week of January as a signal of whether the current record highs are sustainable. The "Tariff Wall," the Fed's leadership transition, and the continued monetization of AI will be the three pillars of the 2026 market narrative.
For now, the tape belongs to the machines and the macro-watchers. While the "Santa Claus Rally" provides a festive end to a historic year, the underlying sensitivity suggests that the quiet of the holiday season is merely the prelude to a much noisier 2026.
This content is intended for informational purposes only and is not financial advice.


