One of the biggest challenges in technical analysis is separating noise from structure. Price charts are full of small moves, fake breakouts, and intraday volatility that can make it difficult to see what actually matters.
That’s where the ZigZag indicator comes in.
In a recent Market on Close segment, Senior Market Strategist John Rowland, CMT, introduced a new feature now available on Barchart charts: the ZigZag indicator, a tool designed to clearly highlight swing highs and swing lows.
And sometimes that clarity changes how you interpret the entire chart.
What the ZigZag Indicator Actually Does
Instead of plotting every price movement, the ZigZag indicator filters out smaller fluctuations and connects only meaningful price swings. The result is a much cleaner view of market structure.
Traders can configure the indicator using:
- Percentage moves
- Volatility-based thresholds
Rowland prefers the volatility-based version, because it adjusts to the natural movement of the asset rather than relying on fixed percentage changes. This makes it particularly useful for analyzing trend structure in volatile stocks.
Using Google as an Example
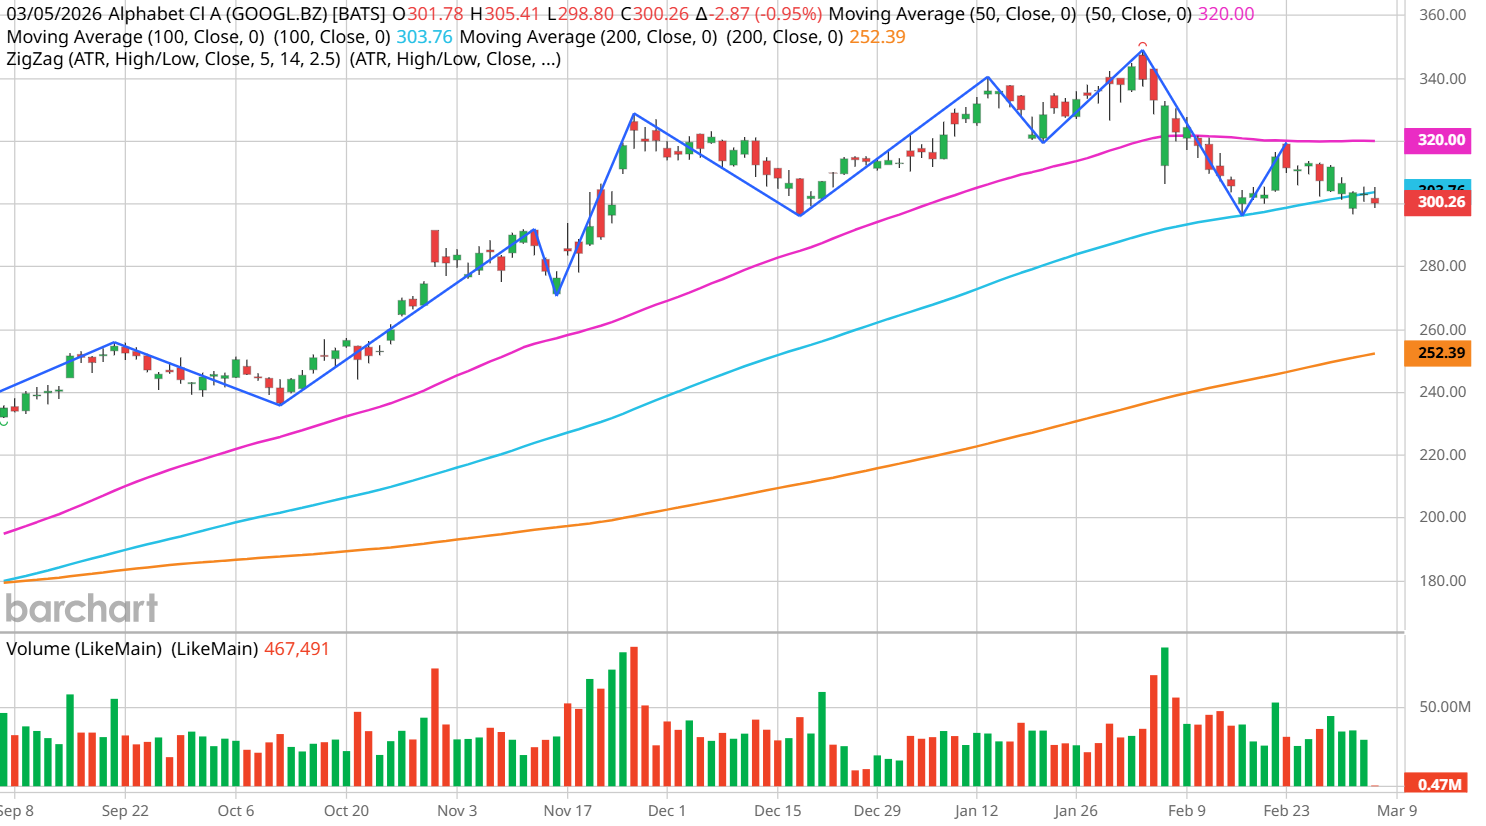
In the segment, Rowland demonstrates the indicator using Alphabet Inc. (GOOG) (GOOGL).
When the ZigZag overlay is isolated from the price candles, the trend becomes much easier to interpret.
Despite recent weakness, the structure still shows a series of higher highs and higher lows — the defining characteristic of an uptrend. According to Rowland, the key signal for a true trend reversal isn’t the first break of a swing low. It’s the second break.
That’s when market structure actually shifts. Until then, the broader trend often remains intact.
The Levels That Matter
In Google’s case, two moving averages are acting as critical reference points.
- 50-day moving average – short-term resistance
- 100-day moving average – structural support
Right now, the stock is trading below the 50-day moving average, which limits the bullish case. But if it holds the 100-day moving average, which was broken in Wednesday’s selloff, the larger uptrend structure may remain intact.
If the stock recaptures the 50-day average, the next logical move would be a new higher high. However, if the 100-day is broken, the next downside target could be the 200-day moving average.
That’s the kind of structural roadmap the ZigZag indicator helps reveal.
Why Traders Use ZigZag
The ZigZag indicator isn’t about predicting the future. It’s about simplifying trend analysis.
It helps traders quickly identify:
- Trend structure (higher highs vs lower highs)
- Potential trend reversals
- Key swing levels
- Momentum shifts
Instead of reacting to every price movement, traders can focus on the swings that actually define the trend.
Watch the clip to see the setup using Google:
- Try the NEW ZigZag indicator on Interactive charts
- Stream the full Market on Close episode on YouTube
On the date of publication, Barchart Insights did not have (either directly or indirectly) positions in any of the securities mentioned in this article. All information and data in this article is solely for informational purposes. For more information please view the Barchart Disclosure Policy here.
More news from Barchart
- South Korea’s Stock Market Just Fell 12% in 1 Day. Here's What It Means for Investors.
- As CoreWeave Signs a Deal with Perplexity, Should You Buy, Sell, or Hold CRWV Stock?
- What Does the Middle East Conflict Mean for Valero Energy Stock?
- This Chart Indicator Clears the Noise to Show a Stock’s Real Trend