“Obvious” news is usually priced in before you can even open your trading app. But the ripple effect of regime change in Venezuela isn’t just a headline — it’s a direct hit to the 2026 supply-and-demand balance. Here is how the U.S. strike on Venezuela and removal of President Nicolás Maduro is likely actually going to play out in the oil markets this year.
The ‘Oversupply’ Anchor
The primary risk isn’t that oil (CBH26) goes to $100. It’s that it struggles to stay above $60. Even before the regime change, the EIA and major banks like Goldman Sachs were forecasting a significant supply glut for 2026. Brent is already feeling the weight, with forecasts revised down toward the $55 level for Q1 2026.
President Donald Trump recently noted that 30 million to 50 million barrels of “sanctioned” oil could hit the U.S. market almost immediately. In a world already swimming in crude, that’s a bearish catalyst that could keep a lid on any price rallies.
The ‘Slow-Motion’ Recovery
While the headlines talk about a “revitalization,” the oil industry is a heavy-duty business. You don’t just flip a switch on a decayed well.
- Short-term (this year): We might see an extra 200,000 to 300,000 barrels per day (bpd) in 2026 simply from basic repairs and workovers.
- Long-term (as in maybe 10 years): To get back to the 3 million bpd levels of the 1990s, experts at Rystad Energy estimate it will take $183 billion and nearly 15 years. This means the threat of a Venezuelan production flood is a slow burn, not a sudden tsunami.
Tactical Winners and Losers
The real movement isn’t in the global price of crude — it’s in the spreads.
- Winners: U.S. Gulf Coast refiners are the big winners. They thrive when heavy crude is cheap and abundant. If Venezuela starts shipping to the U.S. again, their input costs drop significantly.
- Losers: Canadian oil may see its discount to U.S. oil widen. Since Canada and Venezuela produce similar heavy crude, they are now competing for the same refinery space.
What I’m Watching
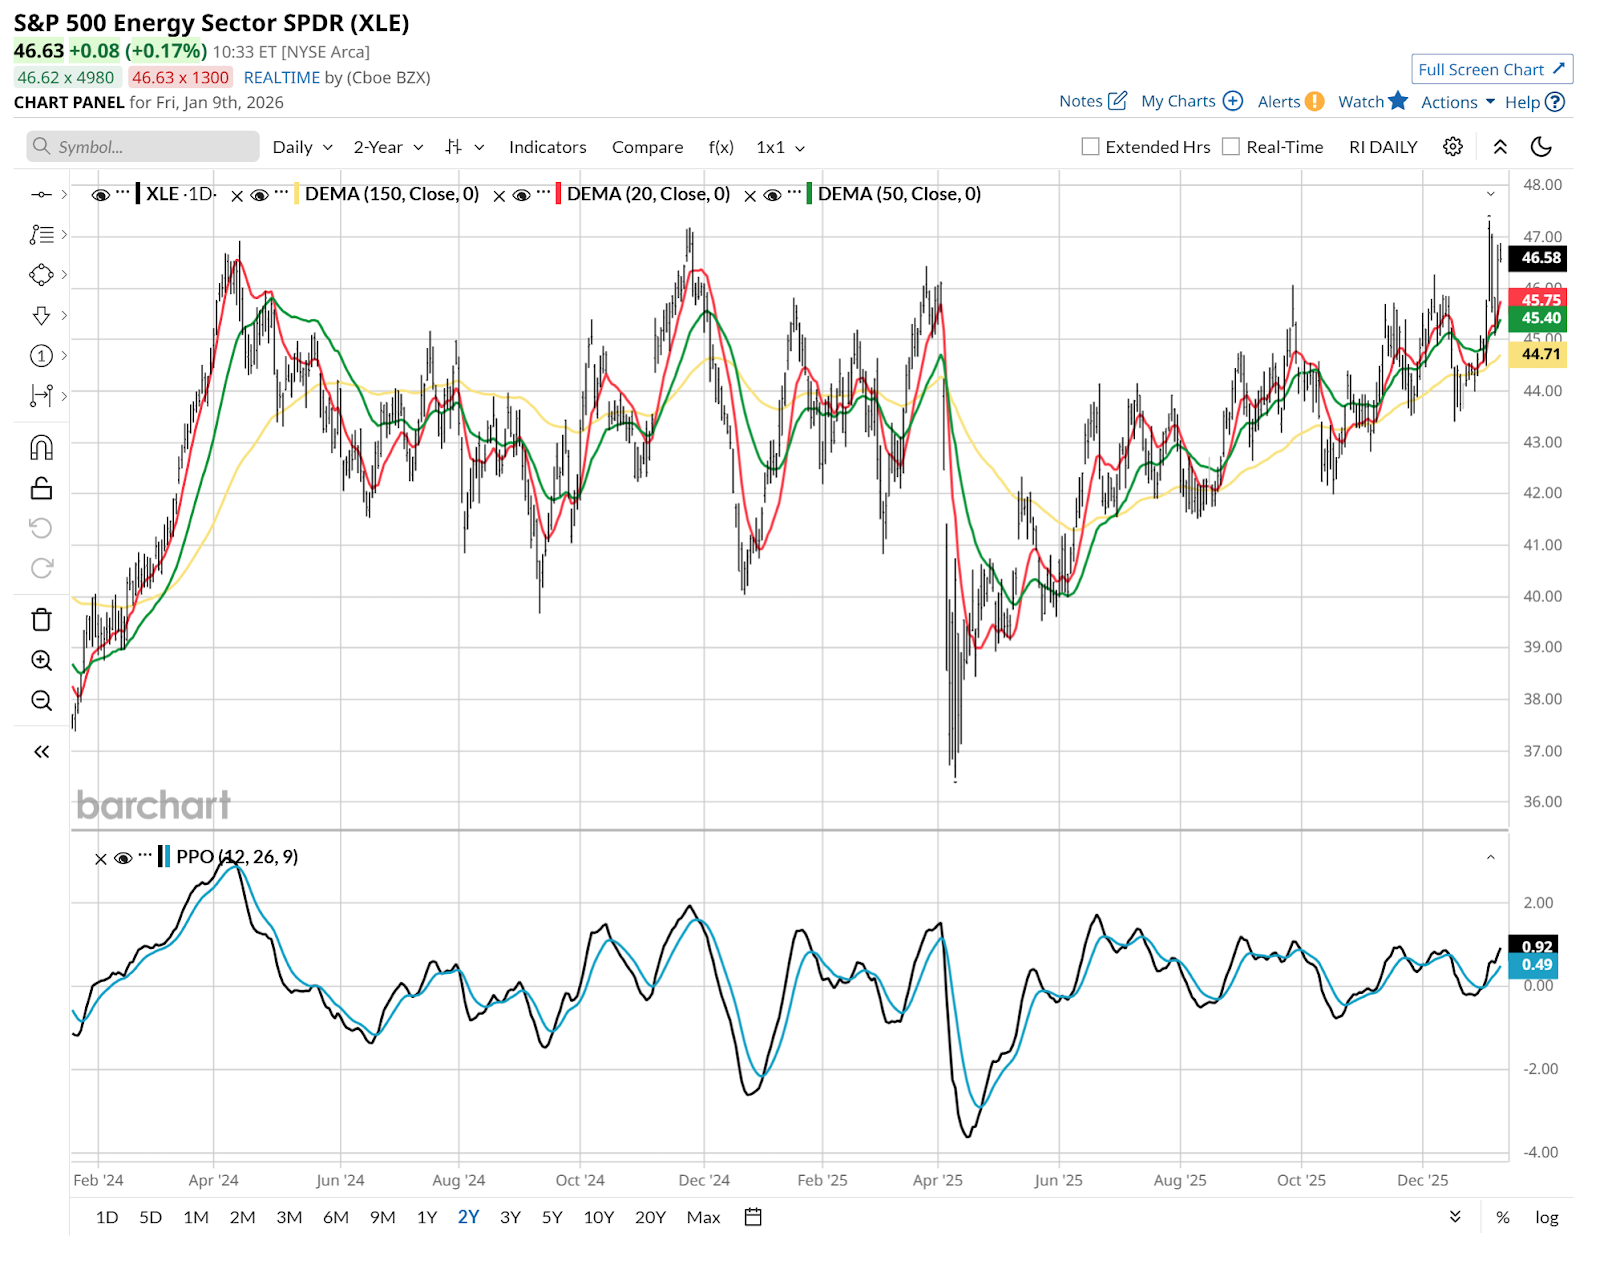
Energy ETFs like S&P 500 Energy Sector SPDR (XLE), which is the allocated basket of energy stocks within the S&P 500 Index ($SPX), looks pretty good here. It has been a rough, jagged path recently, but this news might serve to “clear” the chart pattern. That’s a nice uptrend building. However, this is oil. And with Venezuela news likely to act as a ceiling on prices, we have to constantly think “true rally with muscle behind it, or just a short squeeze?”
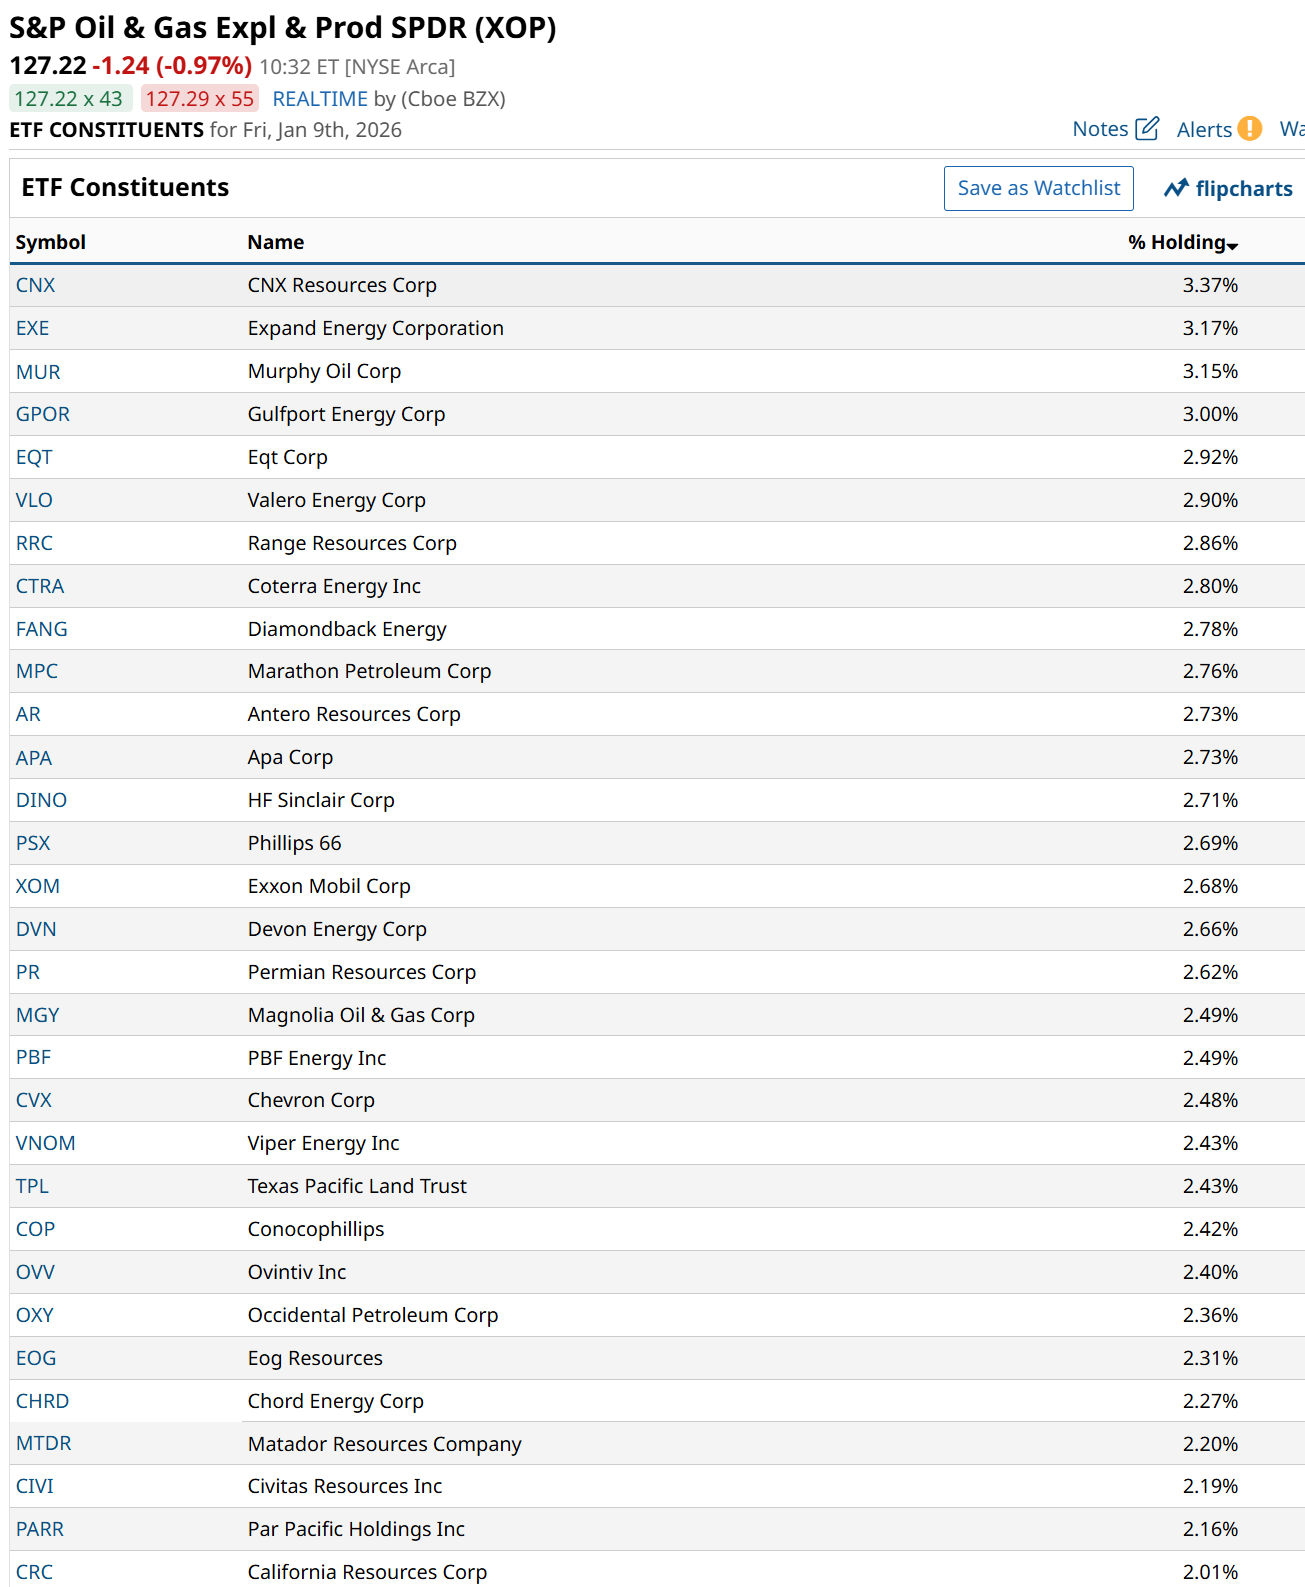
The other ETF I use for quick analysis of the energy sector is the S&P Oil & Gas Expl & Prod SPDR (XOP). Why? Because it contains the major oil stocks, but many more drillers and refiners too. Here’s a list of all current holdings above a 2% weighting, a shopping list perhaps.
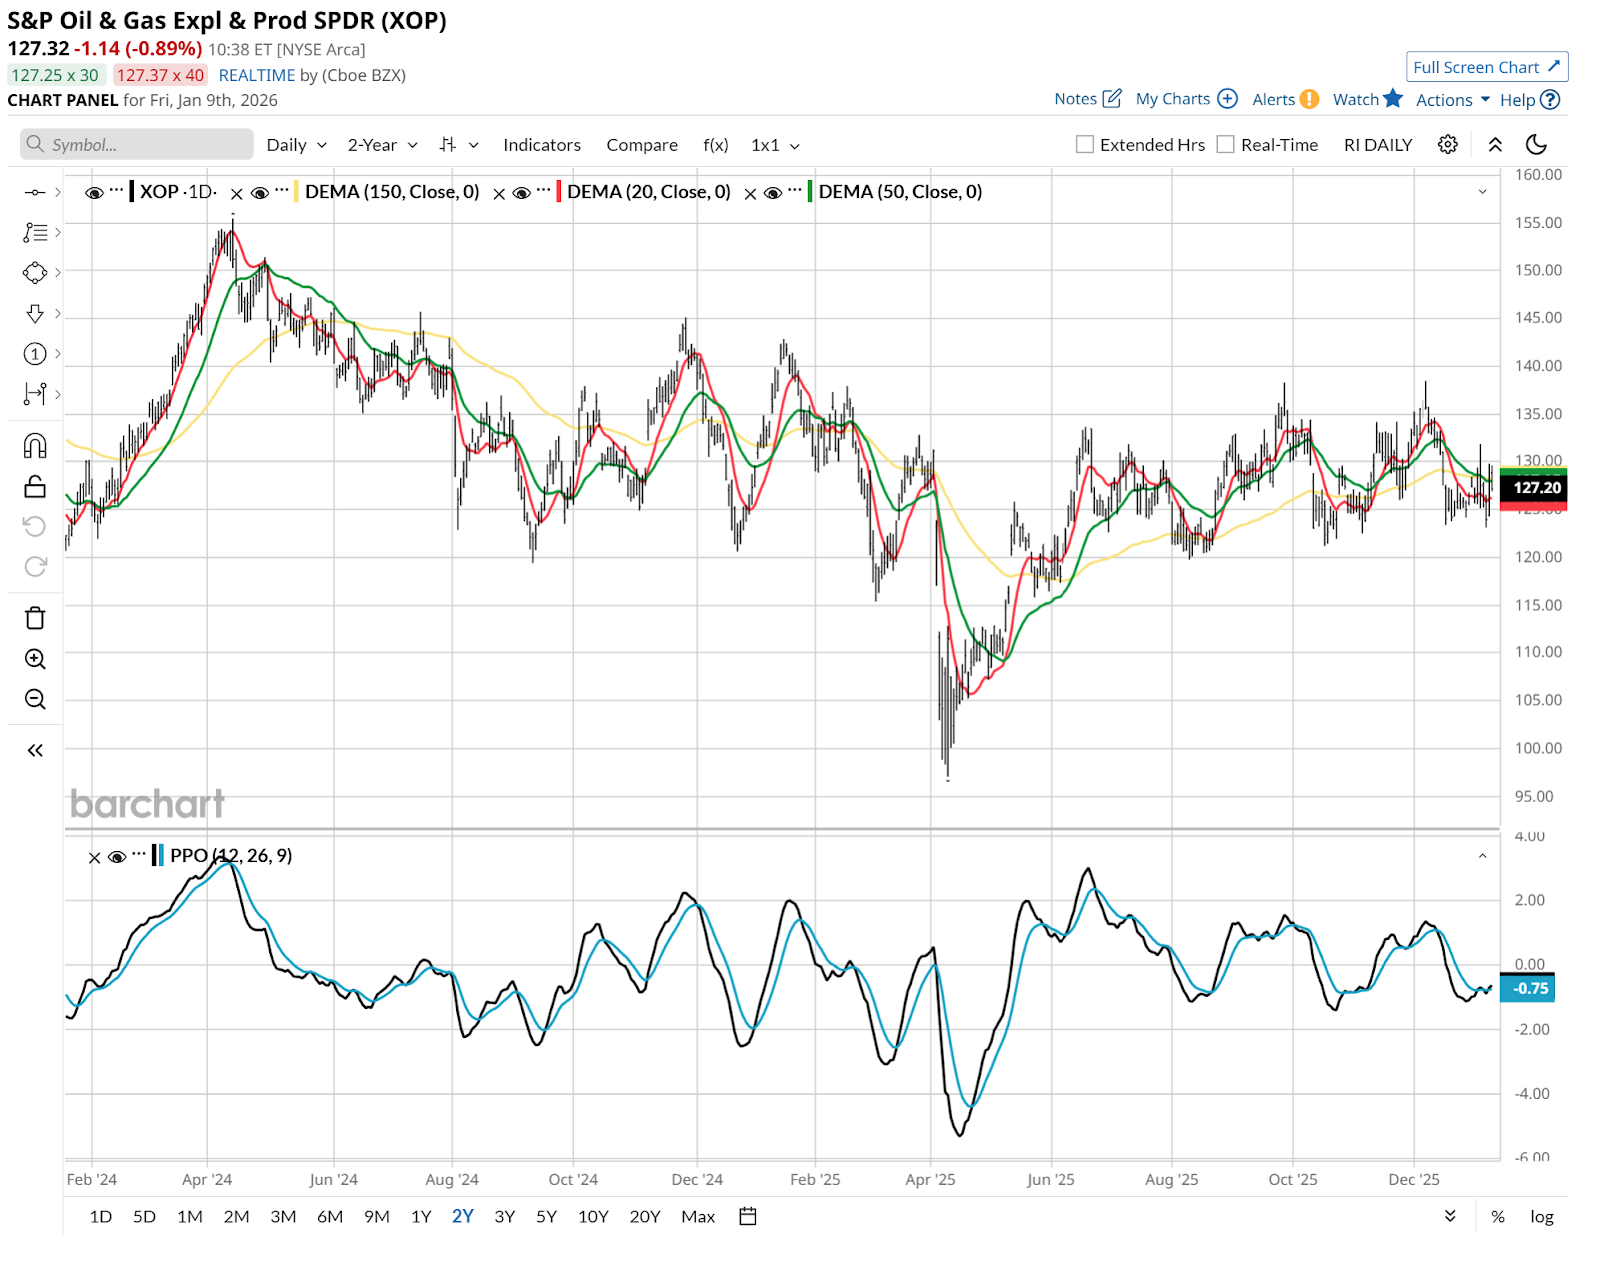
XOP’s chart hints at this being less fruitful for the broader oil stock sector. That’s a very flat chart versus the positive one for XLE. That likely has to do with more of a mix of winners and losers here, whereas XLE is dominated by a few of the biggest energy firms.
This is the start of something to follow in Venezuela. The start of something, just what we don’t know. But I trust the charts to tell us as it evolves.
Rob Isbitts, founder of Sungarden Investment Publishing, is a semi-retired chief investment officer. For more of Rob’s research and investor coaching work, see ETFYourself.com on Substack. To copy-trade Rob’s portfolios, check out the new PiTrade app.
On the date of publication, Rob Isbitts did not have (either directly or indirectly) positions in any of the securities mentioned in this article. All information and data in this article is solely for informational purposes. For more information please view the Barchart Disclosure Policy here.
More news from Barchart
- AI Outlook: Will the Momentum Behind AI Stocks Continue in 2026?
- These 3 ETFs Help You Prosper in a Volatile Market. Which Is Right for You?
- How to Trade Venezuela 10 Days Later: Oil Prices, Energy Stocks, and the Biggest Winners and Losers
- The Market Is Stress Testing Crypto. This 1 ETF Is a Tactical, High-Risk Way to Bet on Its Comeback.


